This map shows 405 reservoirs in 11 western states from November 2025 through September 2026. Each point is one reservoir. Ring size shows capacity. The inner fill shows the share stored that month.
The basemap is Esri’s Oceans basemap, captured once from the Western Water Dashboard’s ArcGIS map. The symbols use the dashboard’s capacity rings and storage colors.

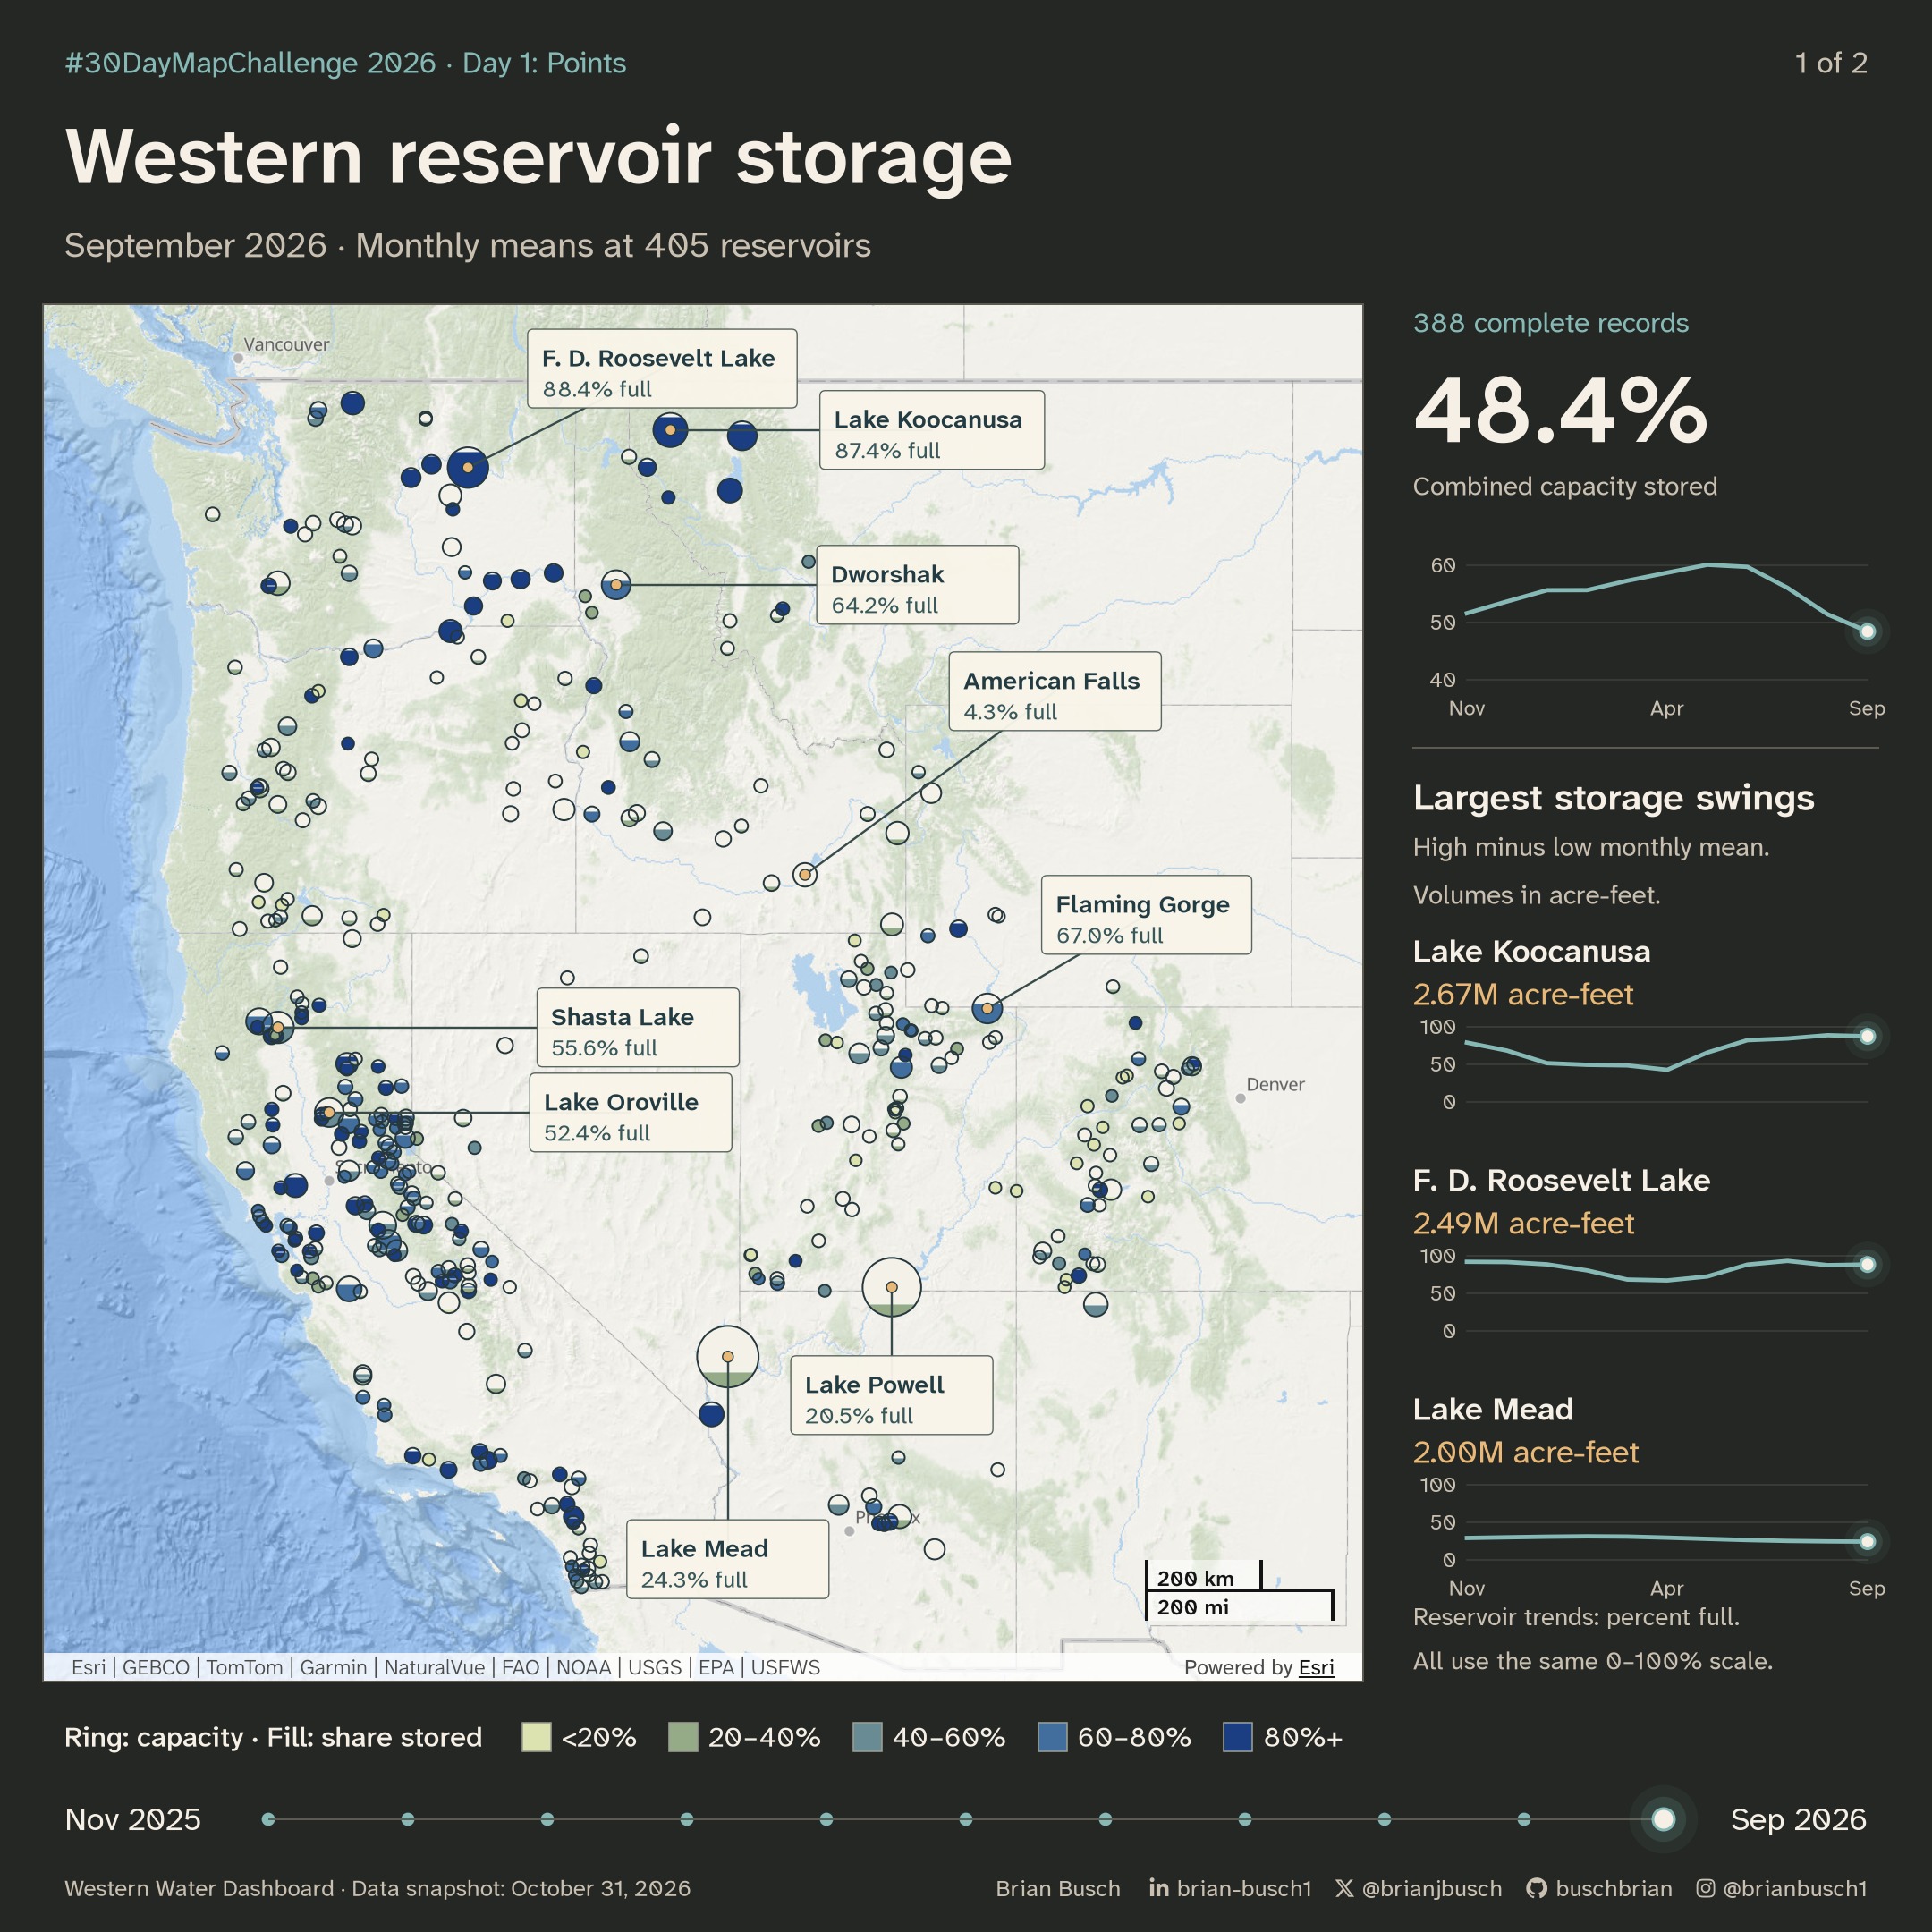
I calculated combined storage for the 388 reservoirs with data for every month. I divided their total monthly mean storage by their total capacity. Combined storage rose from 52% in November to 60% in May. It fell to 48% in September. These are monthly averages.
Lake Mead averaged about 24% full in September. Lake Powell averaged about 20%. I stopped at September because only 292 reservoirs had reported October values.
The dashboard is built on Esri’s ArcGIS Maps SDK for JavaScript. Its reservoir data comes from nine providers. The animation uses the October 31 data snapshot to preserve the historical records.
Where storage changed most
I measure each storage swing from its lowest monthly mean to its highest. This measures a volume range, not total water movement. The comparison covers November 2025 through September 2026. An acre-foot covers one acre with one foot of water.
Lake Koocanusa has the largest swing: 2.67 million acre-feet. Franklin D. Roosevelt Lake follows at 2.49 million. Lake Mead follows at 2.00 million. These are the largest ranges among the 388 complete records.
The map labels the six largest reservoirs by capacity and the eight largest storage swings. Those groups overlap, giving nine labels. The trend panel follows the three largest swings. Each reservoir trend uses the same 0–100% scale.
Volume stored, in millions of acre-feet
-
Lake Koocanusa2.67M acre-feet
-
Franklin D. Roosevelt Lake2.49M acre-feet
-
Lake Mead2.00M acre-feet
-
Lake Powell1.61M acre-feet
-
Shasta Lake1.59M acre-feet
-
Lake Oroville1.58M acre-feet
-
Dworshak Reservoir1.30M acre-feet
-
American Falls Reservoir1.28M acre-feet
View the storage swing values and months
| Reservoir | Lowest | Highest | Range |
|---|---|---|---|
| Lake Koocanusa | 2.48 Apr 2026 | 5.16 Aug 2026 | 2.67 |
| Franklin D. Roosevelt Lake | 6.42 Apr 2026 | 8.91 Jul 2026 | 2.49 |
| Lake Mead | 6.87 Sep 2026 | 8.87 Feb 2026 | 2.00 |
| Lake Powell | 5.12 Sep 2026 | 6.73 Nov 2025 | 1.61 |
| Shasta Lake | 2.53 Sep 2026 | 4.12 Apr 2026 | 1.59 |
| Lake Oroville | 1.79 Nov 2025 | 3.36 May 2026 | 1.58 |
| Dworshak Reservoir | 2.16 Nov 2025 | 3.47 Jun 2026 | 1.30 |
| American Falls Reservoir | 0.07 Sep 2026 | 1.35 Apr 2026 | 1.28 |
Monthly storage in the fixed sample
| Month | Combined storage |
|---|---|
| November 2025 | 51.6% |
| December 2025 | 53.7% |
| January 2026 | 55.6% |
| February 2026 | 55.7% |
| March 2026 | 57.3% |
| April 2026 | 58.7% |
| May 2026 | 60.1% |
| June 2026 | 59.7% |
| July 2026 | 56.1% |
| August 2026 | 51.4% |
| September 2026 | 48.4% |
How many reservoirs were nearly full
The combined figure hides how many reservoirs changed class. In May, 178 of the 388 reservoirs were at least 80% full. By September, 83 were. Over the same months, the number under 20% full rose from 26 to 92.
Together, the 388 reservoirs held 97.1 million acre-feet in May. They held 78.3 million acre-feet in September. That is a drop of 18.8 million acre-feet in four months.
| Share stored | May 2026 | September 2026 |
|---|---|---|
| 80% or more | 178 | 83 |
| 60–80% | 102 | 63 |
| 40–60% | 55 | 65 |
| 20–40% | 27 | 85 |
| Under 20% | 26 | 92 |
How to read the symbols
- Each ring is one reservoir. Ring radius grows with the square root of capacity, so ring area follows capacity. Small reservoirs keep a minimum size so they stay visible.
- The fill rises from the bottom of the ring, like water in a gauge. Its height shows the share of capacity stored that month.
- The fill color repeats that share in five classes: under 20%, 20–40%, 40–60%, 60–80%, and 80% or more. Very small rings use a solid fill in the class color.
- Labels show the share stored for the displayed month. Each label keeps the same position for the whole animation.
- The sidebar shows the combined trend at the top. Below it, three small charts follow the reservoirs with the largest storage swings.
Method
- A fixed snapshot of the dashboard’s reservoir data, from October 31, 2026, supplies monthly mean storage for each reservoir.
- The basemap is one capture of the dashboard’s ArcGIS map, with Esri’s Oceans basemap, its attribution, and its scale bar.
- Each reservoir is projected to Web Mercator, the projection of the basemap, and placed on the capture.
- Label placement tests candidate positions and avoids overlaps with other labels and rings.
Storage moves from one monthly mean to the next. The tables and labels show the observed monthly values, not the values between months.
Data notes
- These are monthly means. A reservoir can be higher or lower than its monthly mean on single days.
- In 92 reservoir-months, the monthly mean is above the listed capacity. Listed capacities can differ from current operating limits. The map shows these months as full.
- Green Peter reports −1,020 acre-feet for November 2025. A negative volume is not physically possible, so the reading is a provider or conversion error. The map shows it as under 20%. Its effect on the combined figure is less than 0.001 percentage points.
- Seventeen reservoirs do not have all 11 monthly values. They stay on the map for the months they report, but the combined figure leaves them out. The 388 complete reservoirs hold 98% of the 405 reservoirs’ total capacity.
Sources and map services
Reservoir readings from nine public providers, through the Western Water Dashboard. Read the source data.
Esri provides the Oceans basemap and the ArcGIS Maps SDK for JavaScript. The map retains the basemap’s provider attribution.
The figures use fixed data snapshots. Download the figure data.