This map shows daily precipitation totals at 111 mountain weather stations. The stations are in Utah, Colorado, Arizona and New Mexico.
SNOTEL is a mountain monitoring network run by the USDA Natural Resources Conservation Service. Each point represents one SNOTEL station. Point color and size show precipitation accumulated since October 1. The totals include rain and snow measured as water.

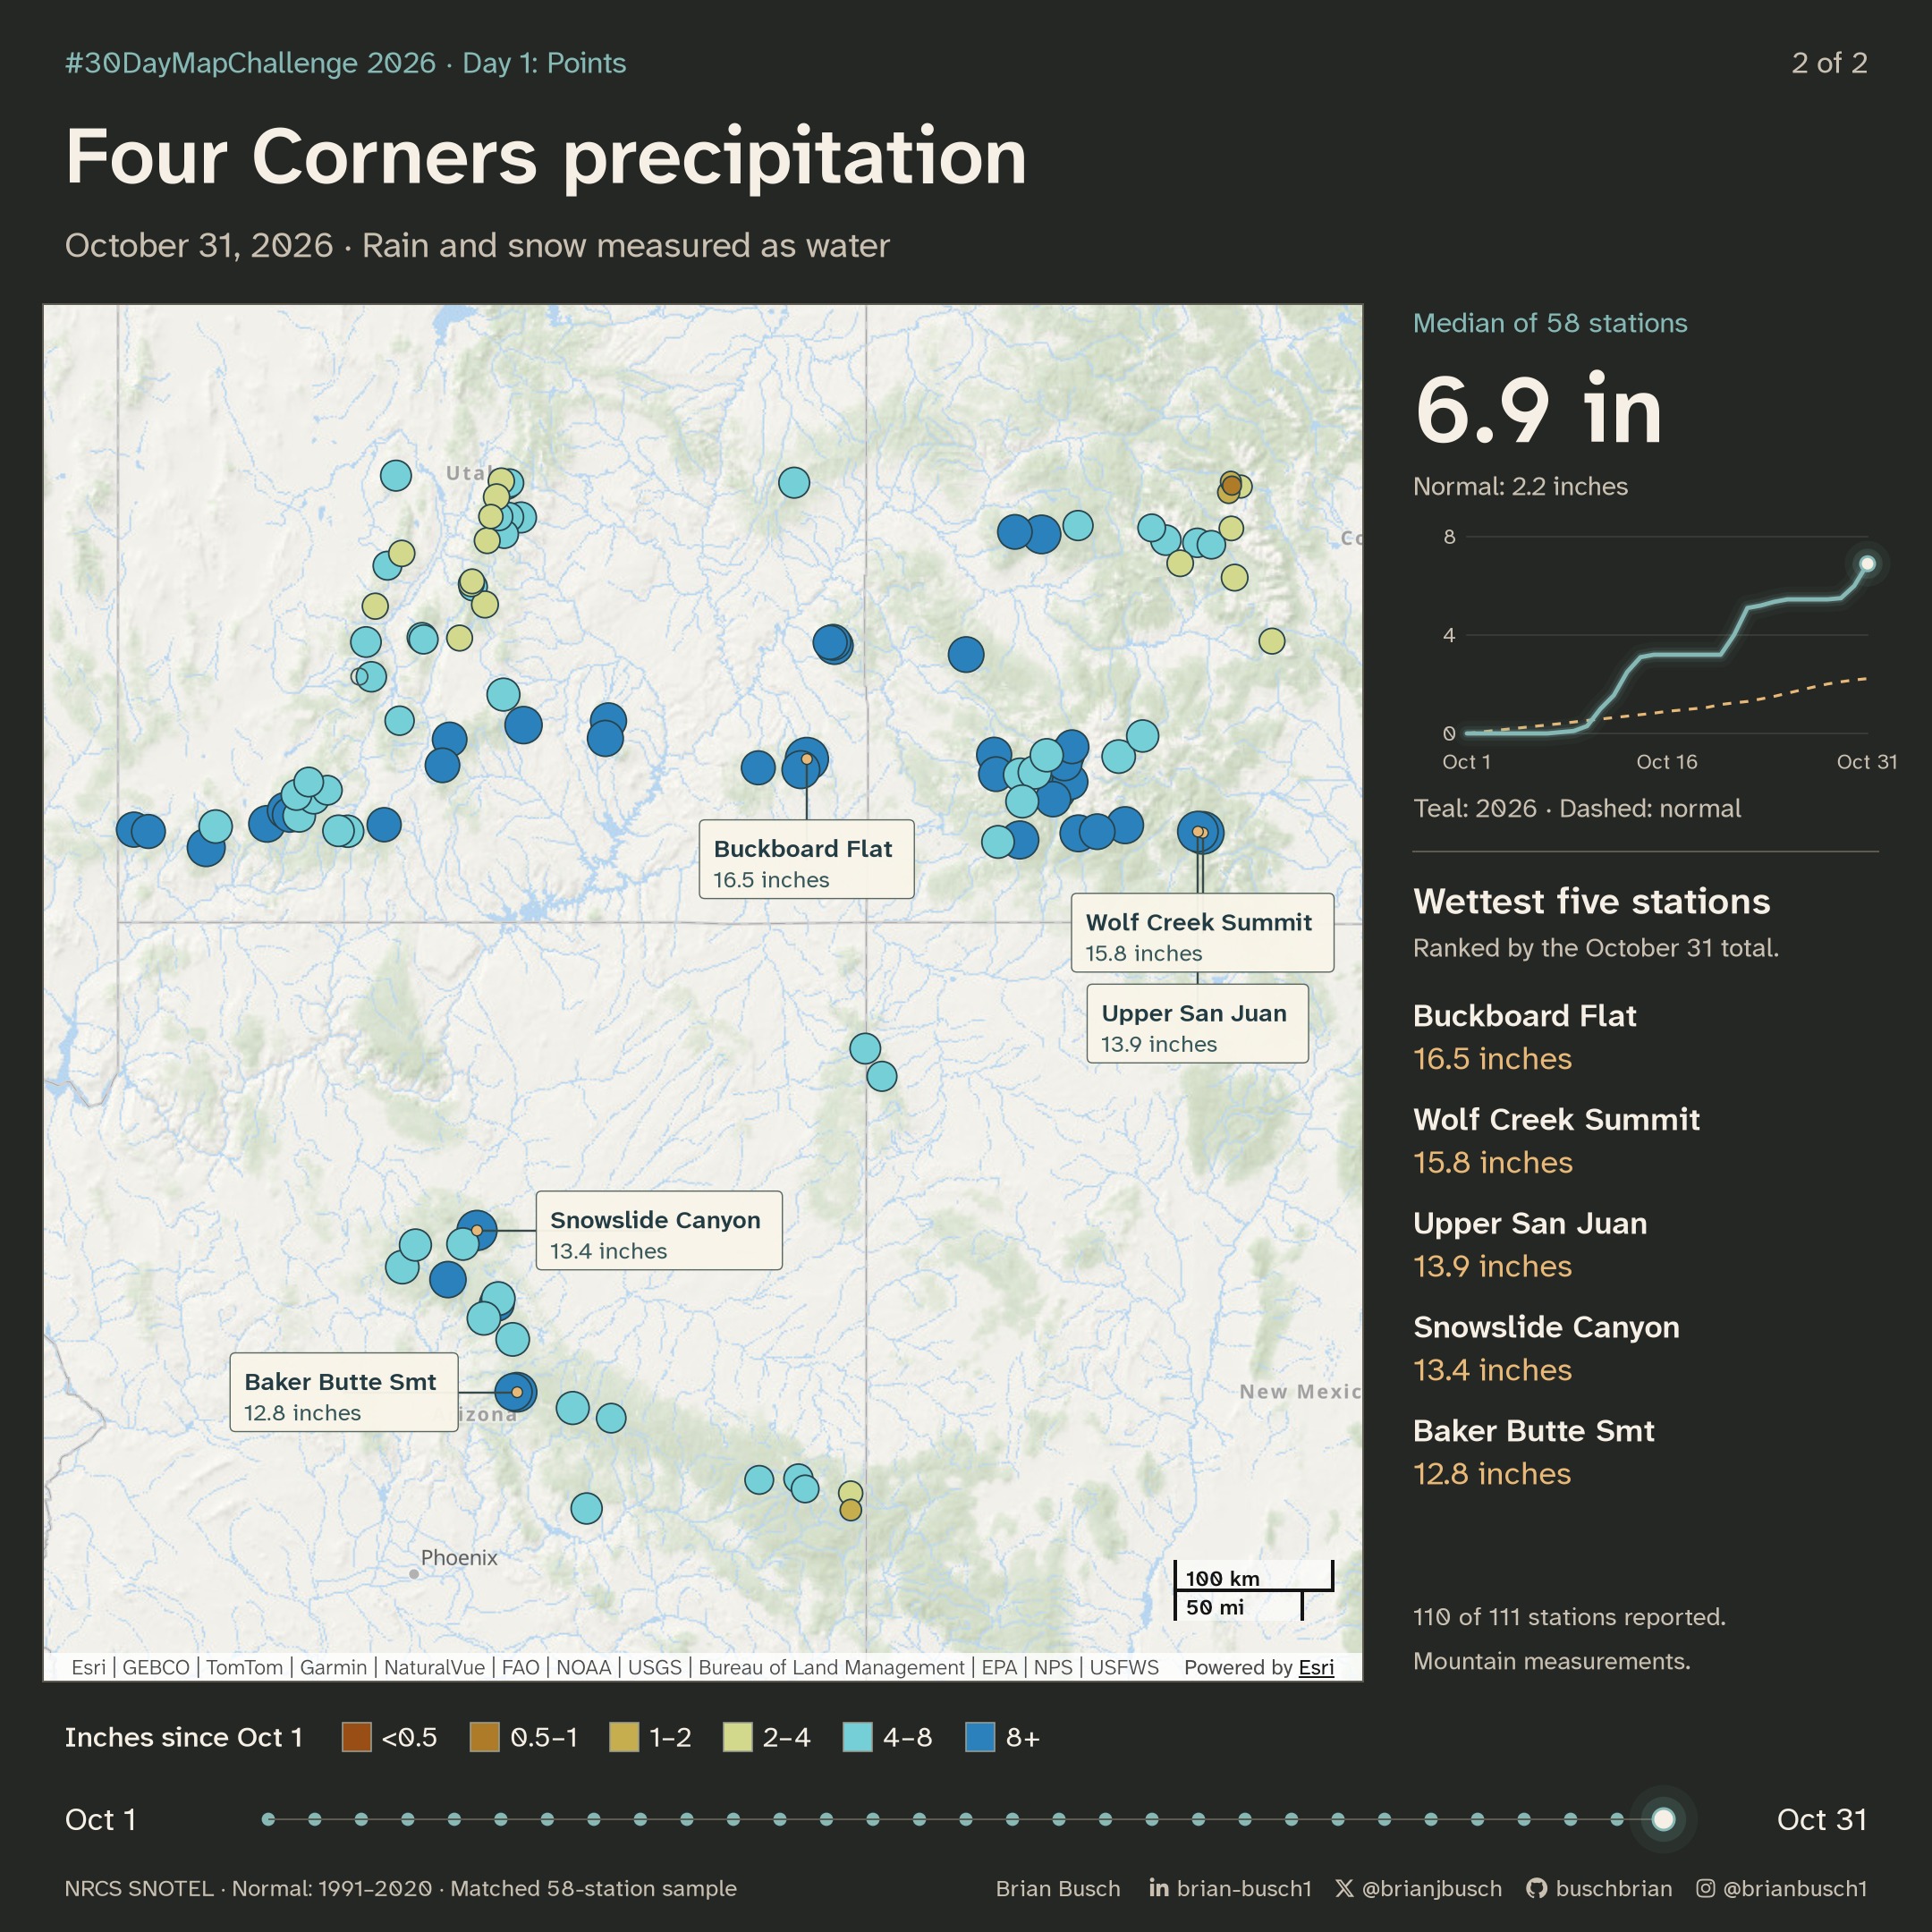
I used the 58 stations whose stored records cover every water year from 1991 through 2026 for the normal comparison. Their median total reached 6.9 inches by October 31. Their 1991–2020 median normal for that date was about 2.2 inches.
The main wet periods were October 10–14, 21–22 and 30–31. These mountain measurements do not describe precipitation totals in nearby cities.
The basemap is Esri’s Oceans basemap, captured once from the dashboard’s ArcGIS map. The symbols use the dashboard’s precipitation colors. A ripple marks each day that a station gains half an inch or more. Hollow markers show missing readings. On October 31, 110 of the 111 mapped stations reported.
The data comes through the Western Water Dashboard. Its data pipeline is scheduled to refresh station readings each day. The dashboard is built on Esri’s ArcGIS Maps SDK for JavaScript.
This point map is a bonus entry. Day 3’s theme is Polygons.
The wettest stations
| Station | State | Inches |
|---|---|---|
| Buckboard Flat | Utah | 16.5 |
| Wolf Creek Summit | Colorado | 15.8 |
| Upper San Juan | Colorado | 13.9 |
| Snowslide Canyon | Arizona | 13.4 |
| Baker Butte Smt | Arizona | 12.8 |
How October unfolded
The median stayed near zero for the first week. Three storm periods then did most of the work.
- October 10–14 added 3.0 inches to the median, from 0.1 to 3.1 inches. The median passed the normal for the date on October 11 and stayed above it.
- October 21–22 added 1.9 inches, from 3.2 to 5.1 inches.
- October 30–31 added 1.4 inches, from 5.5 to 6.9 inches.
By October 31, the median was about three times the normal for that date. The largest one-day gain was at Snowslide Canyon in Arizona: 4.3 inches on October 11.
View the daily median and normal
| Date | Median | Normal | Stations reporting |
|---|---|---|---|
| October 1 | 0.00 | 0.00 | 111 |
| October 2 | 0.00 | 0.06 | 111 |
| October 3 | 0.00 | 0.11 | 111 |
| October 4 | 0.00 | 0.17 | 111 |
| October 5 | 0.00 | 0.23 | 111 |
| October 6 | 0.00 | 0.29 | 111 |
| October 7 | 0.00 | 0.34 | 111 |
| October 8 | 0.05 | 0.40 | 111 |
| October 9 | 0.10 | 0.46 | 111 |
| October 10 | 0.30 | 0.53 | 111 |
| October 11 | 1.00 | 0.59 | 111 |
| October 12 | 1.55 | 0.64 | 111 |
| October 13 | 2.50 | 0.70 | 111 |
| October 14 | 3.10 | 0.76 | 111 |
| October 15 | 3.20 | 0.82 | 111 |
| October 16 | 3.20 | 0.90 | 111 |
| October 17 | 3.20 | 0.95 | 111 |
| October 18 | 3.20 | 1.00 | 111 |
| October 19 | 3.20 | 1.06 | 111 |
| October 20 | 3.20 | 1.17 | 111 |
| October 21 | 4.00 | 1.24 | 111 |
| October 22 | 5.10 | 1.30 | 111 |
| October 23 | 5.20 | 1.40 | 111 |
| October 24 | 5.35 | 1.51 | 111 |
| October 25 | 5.45 | 1.64 | 111 |
| October 26 | 5.45 | 1.76 | 111 |
| October 27 | 5.45 | 1.89 | 111 |
| October 28 | 5.45 | 2.01 | 111 |
| October 29 | 5.50 | 2.10 | 111 |
| October 30 | 6.00 | 2.17 | 109 |
| October 31 | 6.90 | 2.23 | 110 |
By state
Colorado stations had the highest median total. Utah has the most stations on the map. New Mexico has one station inside the map frame.
| State | Stations | Median | Highest |
|---|---|---|---|
| Colorado | 37 | 7.8 | 15.8 |
| Arizona | 20 | 7.2 | 13.4 |
| Utah | 52 of 53 | 6.0 | 16.5 |
| New Mexico | 1 | 5.4 | 5.4 |
On October 31, 40 of the 110 reporting stations had 8 inches or more. Another 50 had 4 to 8 inches. Only four stations had less than 2 inches.
How to read the symbols
- Each circle is one SNOTEL station. Circle radius grows with the square root of the accumulated total, so larger totals make larger circles.
- Color shows the same total in six classes, with breaks at 0.5, 1, 2, 4, and 8 inches. The colors follow the dashboard’s precipitation colors.
- A ripple marks each day that a station gains half an inch or more. October had 571 of these station-days.
- Hollow markers show missing readings. A missing day stays missing. The animation does not fill it from nearby days.
- The sidebar compares the median with the normal, then lists the five wettest stations by their October 31 totals.
Method
- A fixed snapshot of the dashboard’s station data, from November 1, 2026, supplies the daily totals.
- The basemap is one capture of the dashboard’s ArcGIS map, zoomed to the Four Corners.
- Each station is projected to Web Mercator, the projection of the basemap, and placed on the capture.
- Circle sizes change from one daily total to the next.
Data notes
- The water year starts on October 1. October totals are therefore also water-year totals.
- The normal comes from stored weekly medians for 1991–2020. The figure interpolates between weekly values for each date.
- The comparison uses the 58 stations whose stored records cover every water year from 1991 through 2026. The other 53 stations have a gap in that period. For five of them, the first gap comes after 2020.
- Mountain stations sit high in the watersheds. Their totals do not describe precipitation in nearby cities.
Sources and map services
USDA Natural Resources Conservation Service SNOTEL readings and historical precipitation records. Read the source data.
Esri provides the Oceans basemap and the ArcGIS Maps SDK for JavaScript. The map retains the basemap’s provider attribution.
Open the dashboard’s precipitation page.
The figures use fixed data snapshots. Download the figure data.