The polygons are the data
The U.S. Drought Monitor is a weekly map. Its authors draw the drought lines by hand. They combine many indicators with local reports. The classes go from D0, abnormally dry, to D4, exceptional drought.
The map here clips those polygons to 75 drainage basins. A drainage basin is land that drains toward a common outlet. These are six-digit hydrologic units, called HUC-6 basins, from the USGS Watershed Boundary Dataset.

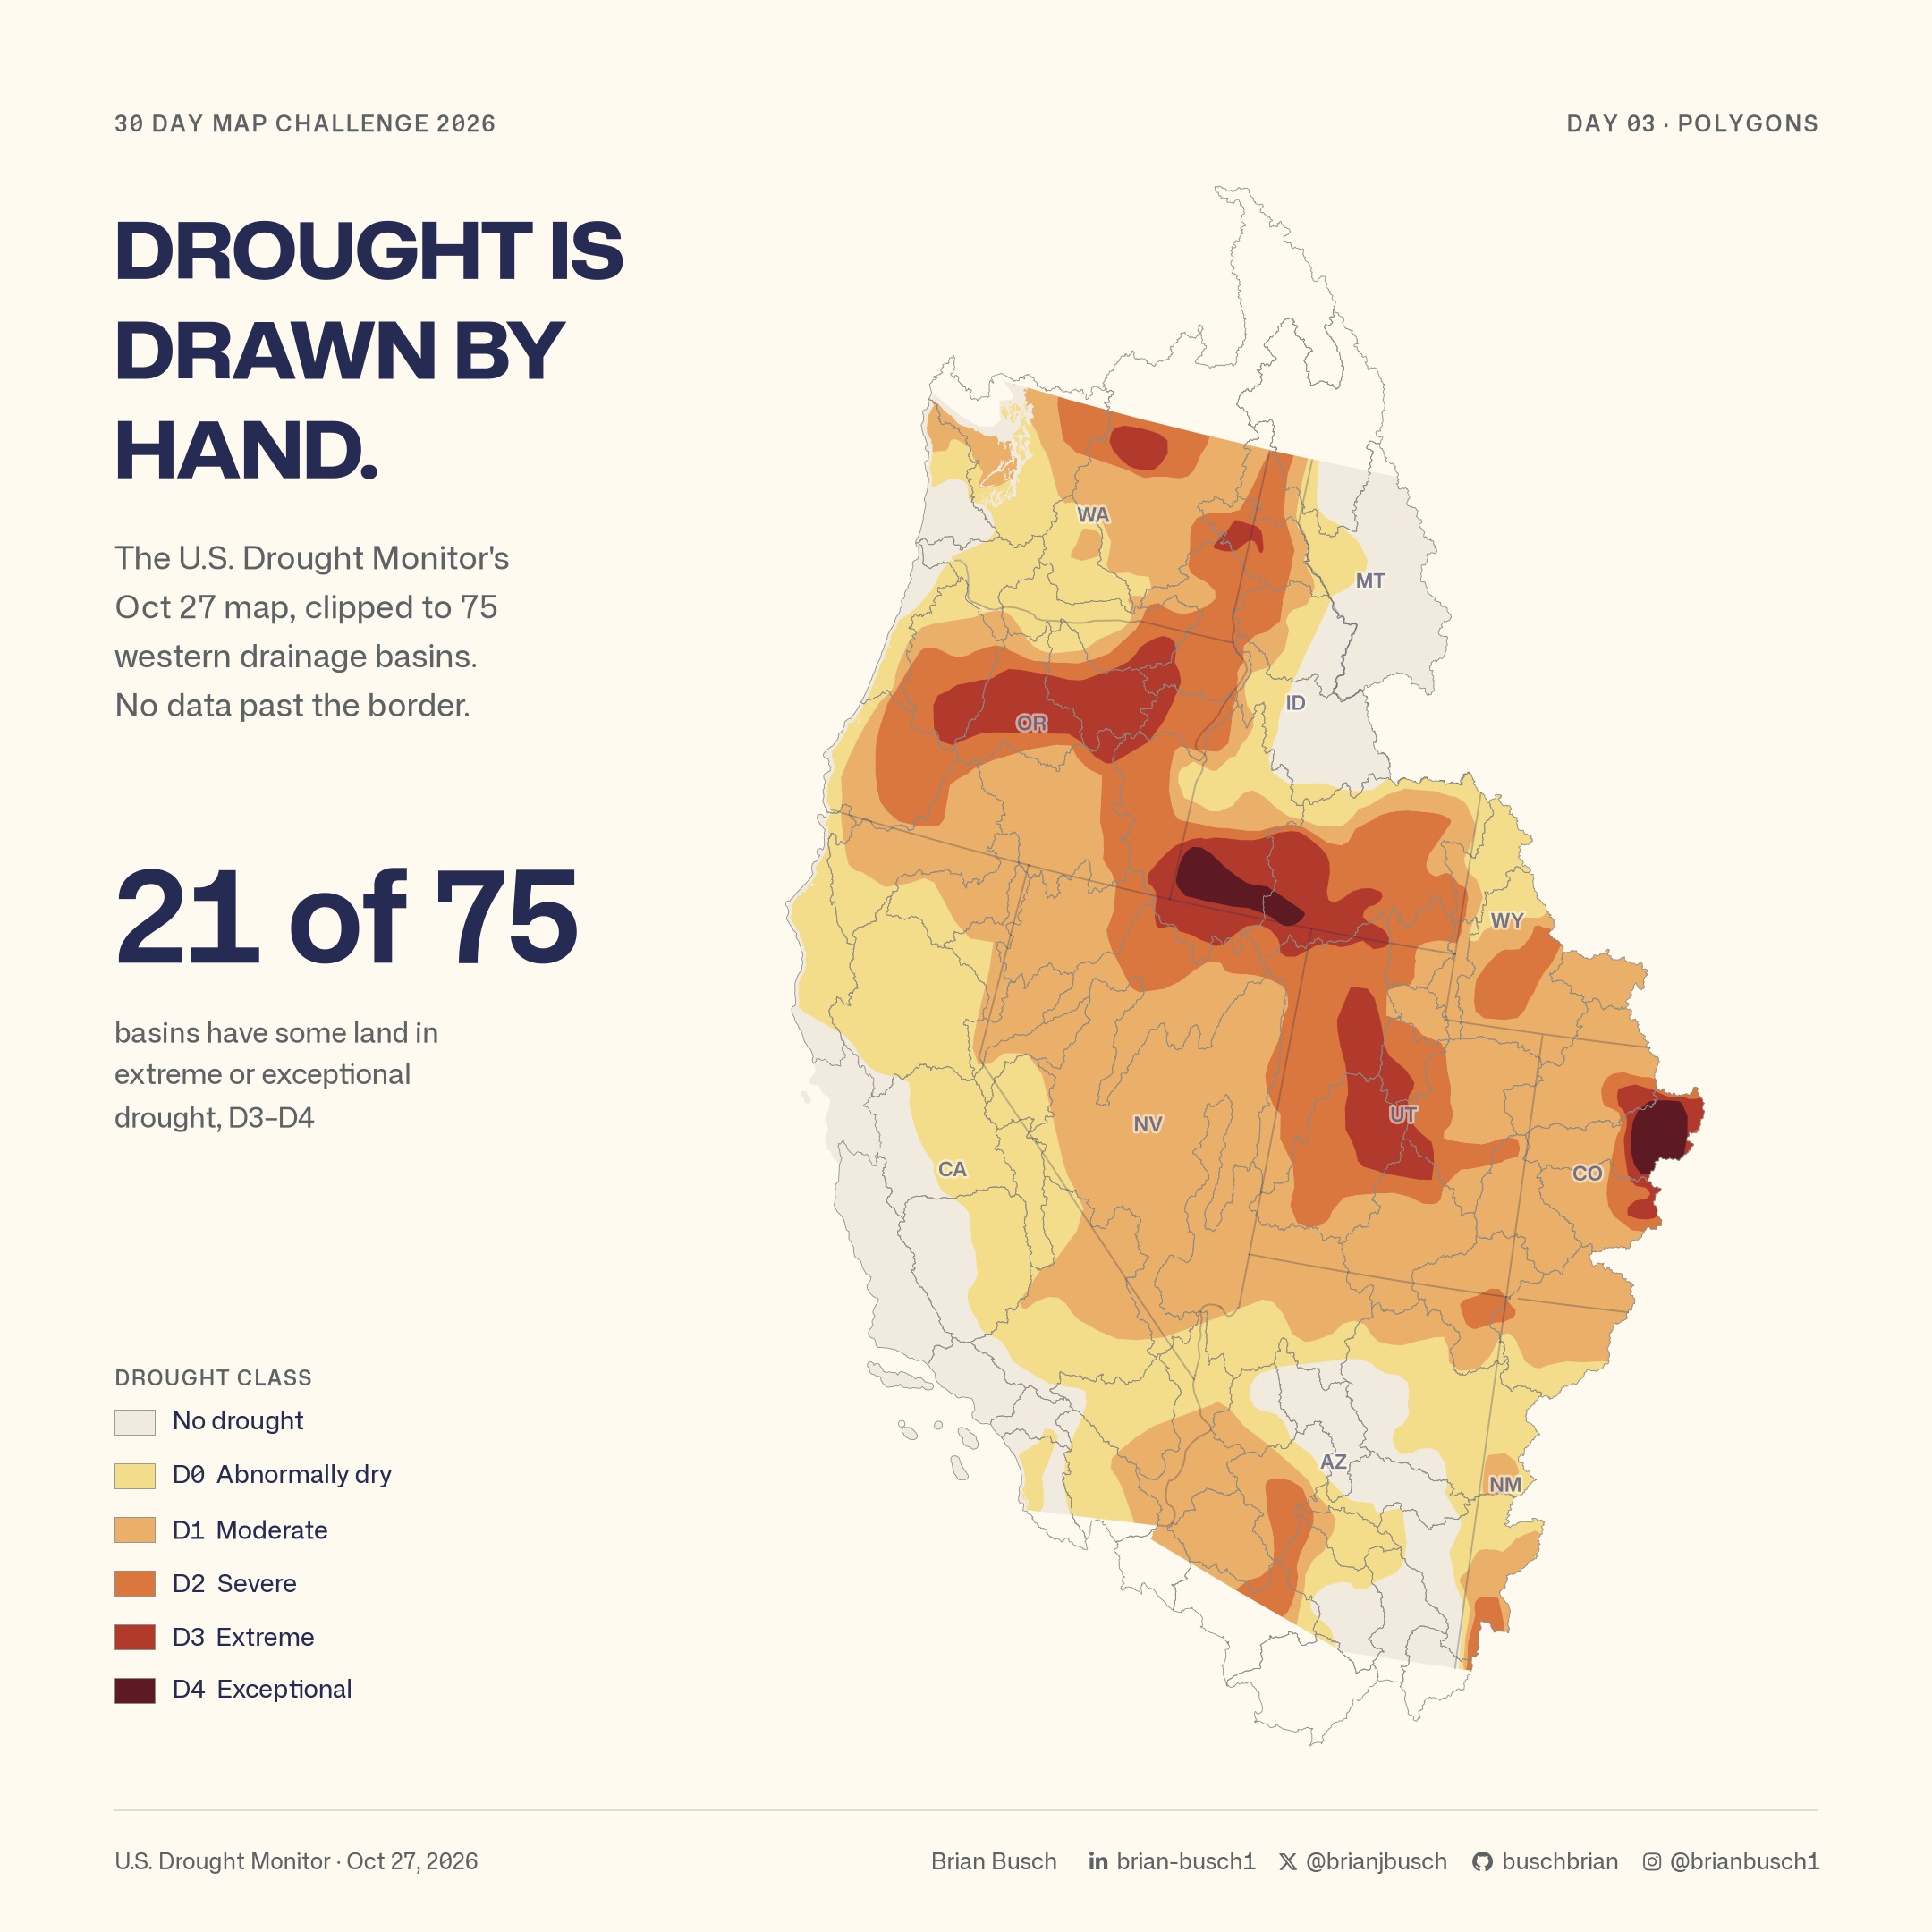
On October 27, 21 of the 75 basins had some land in extreme or exceptional drought, D3 or D4.
Ten years, basin by basin
The second scene changes the measure. Each basin gets the share of its land at D2, severe drought, or worse. The scene replays every weekly map from November 2016 to October 2026.
A share of land is a fairer measure than the worst class present. One small patch of D4 does not make a large basin look exceptional.

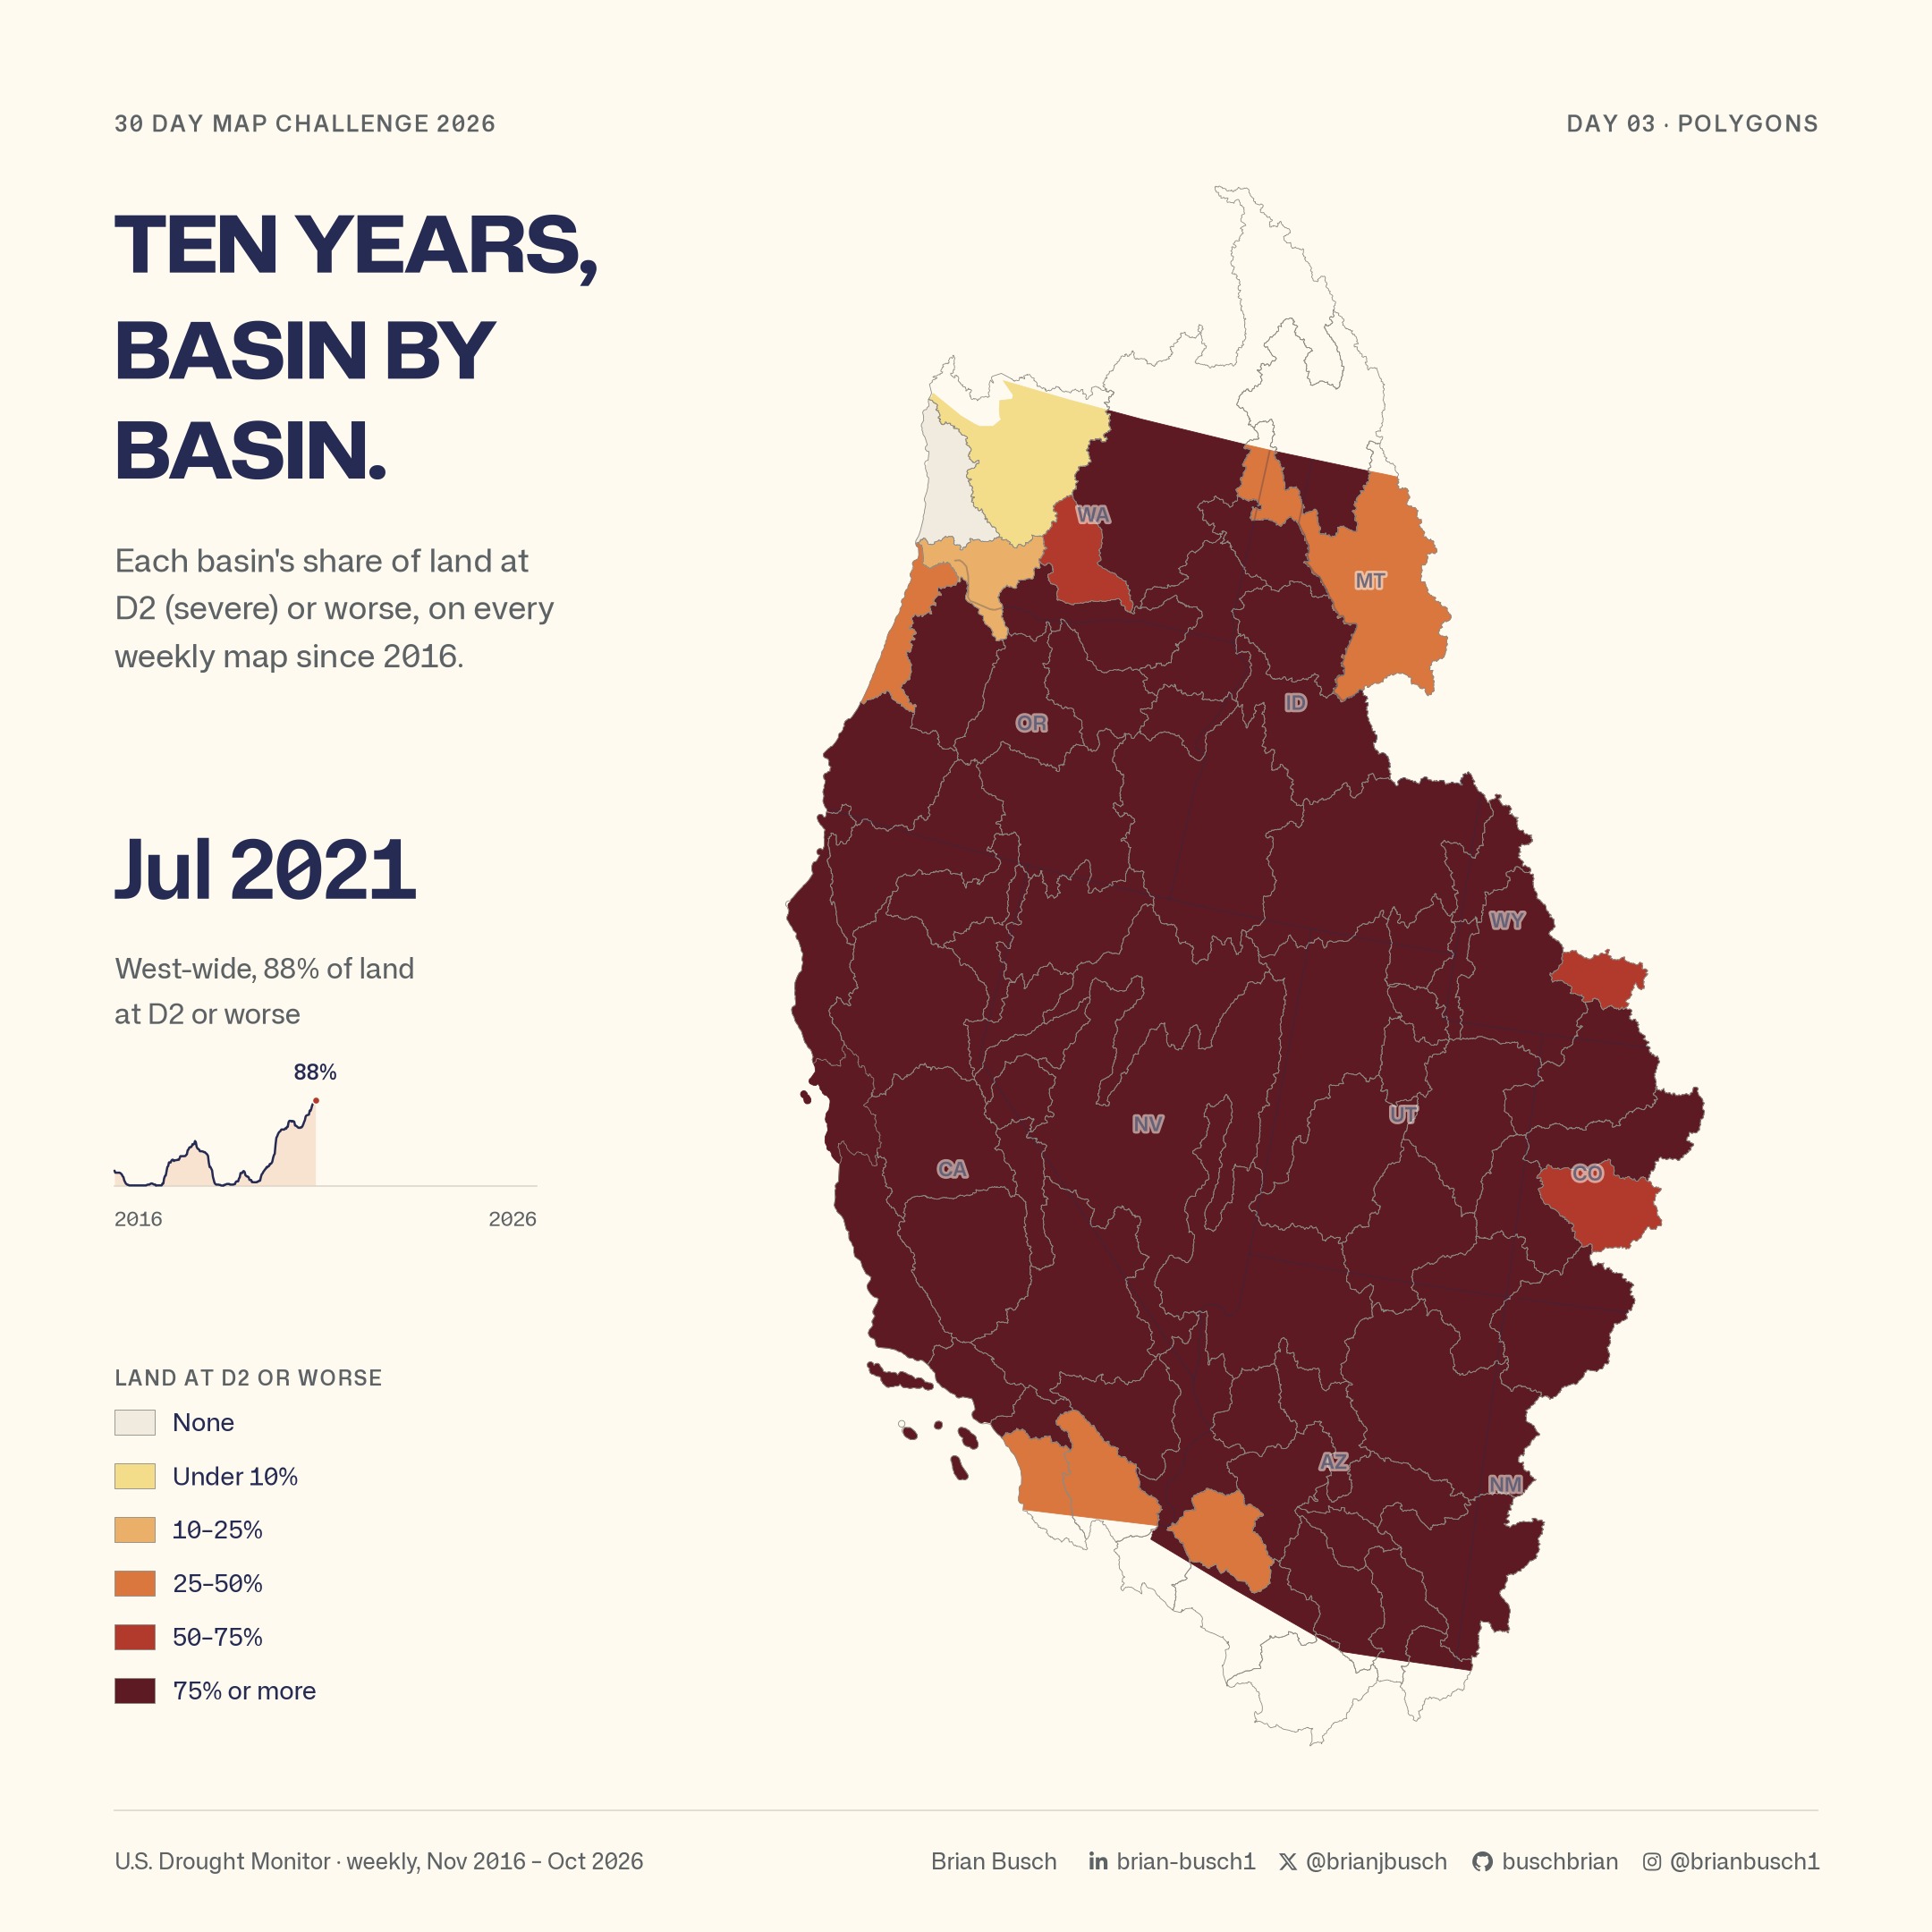
Across all 75 basins, the highest share in this record was 88%, on July 27, 2021. The West-wide share weights each basin by its U.S. land area.
The fall eased it, mostly
In 2026 the share reached 47% on August 4. By October 27 it was 23%.
From October 20 to October 27, 19 basins had less land at D2 or worse. None had more. The other 56 did not change.

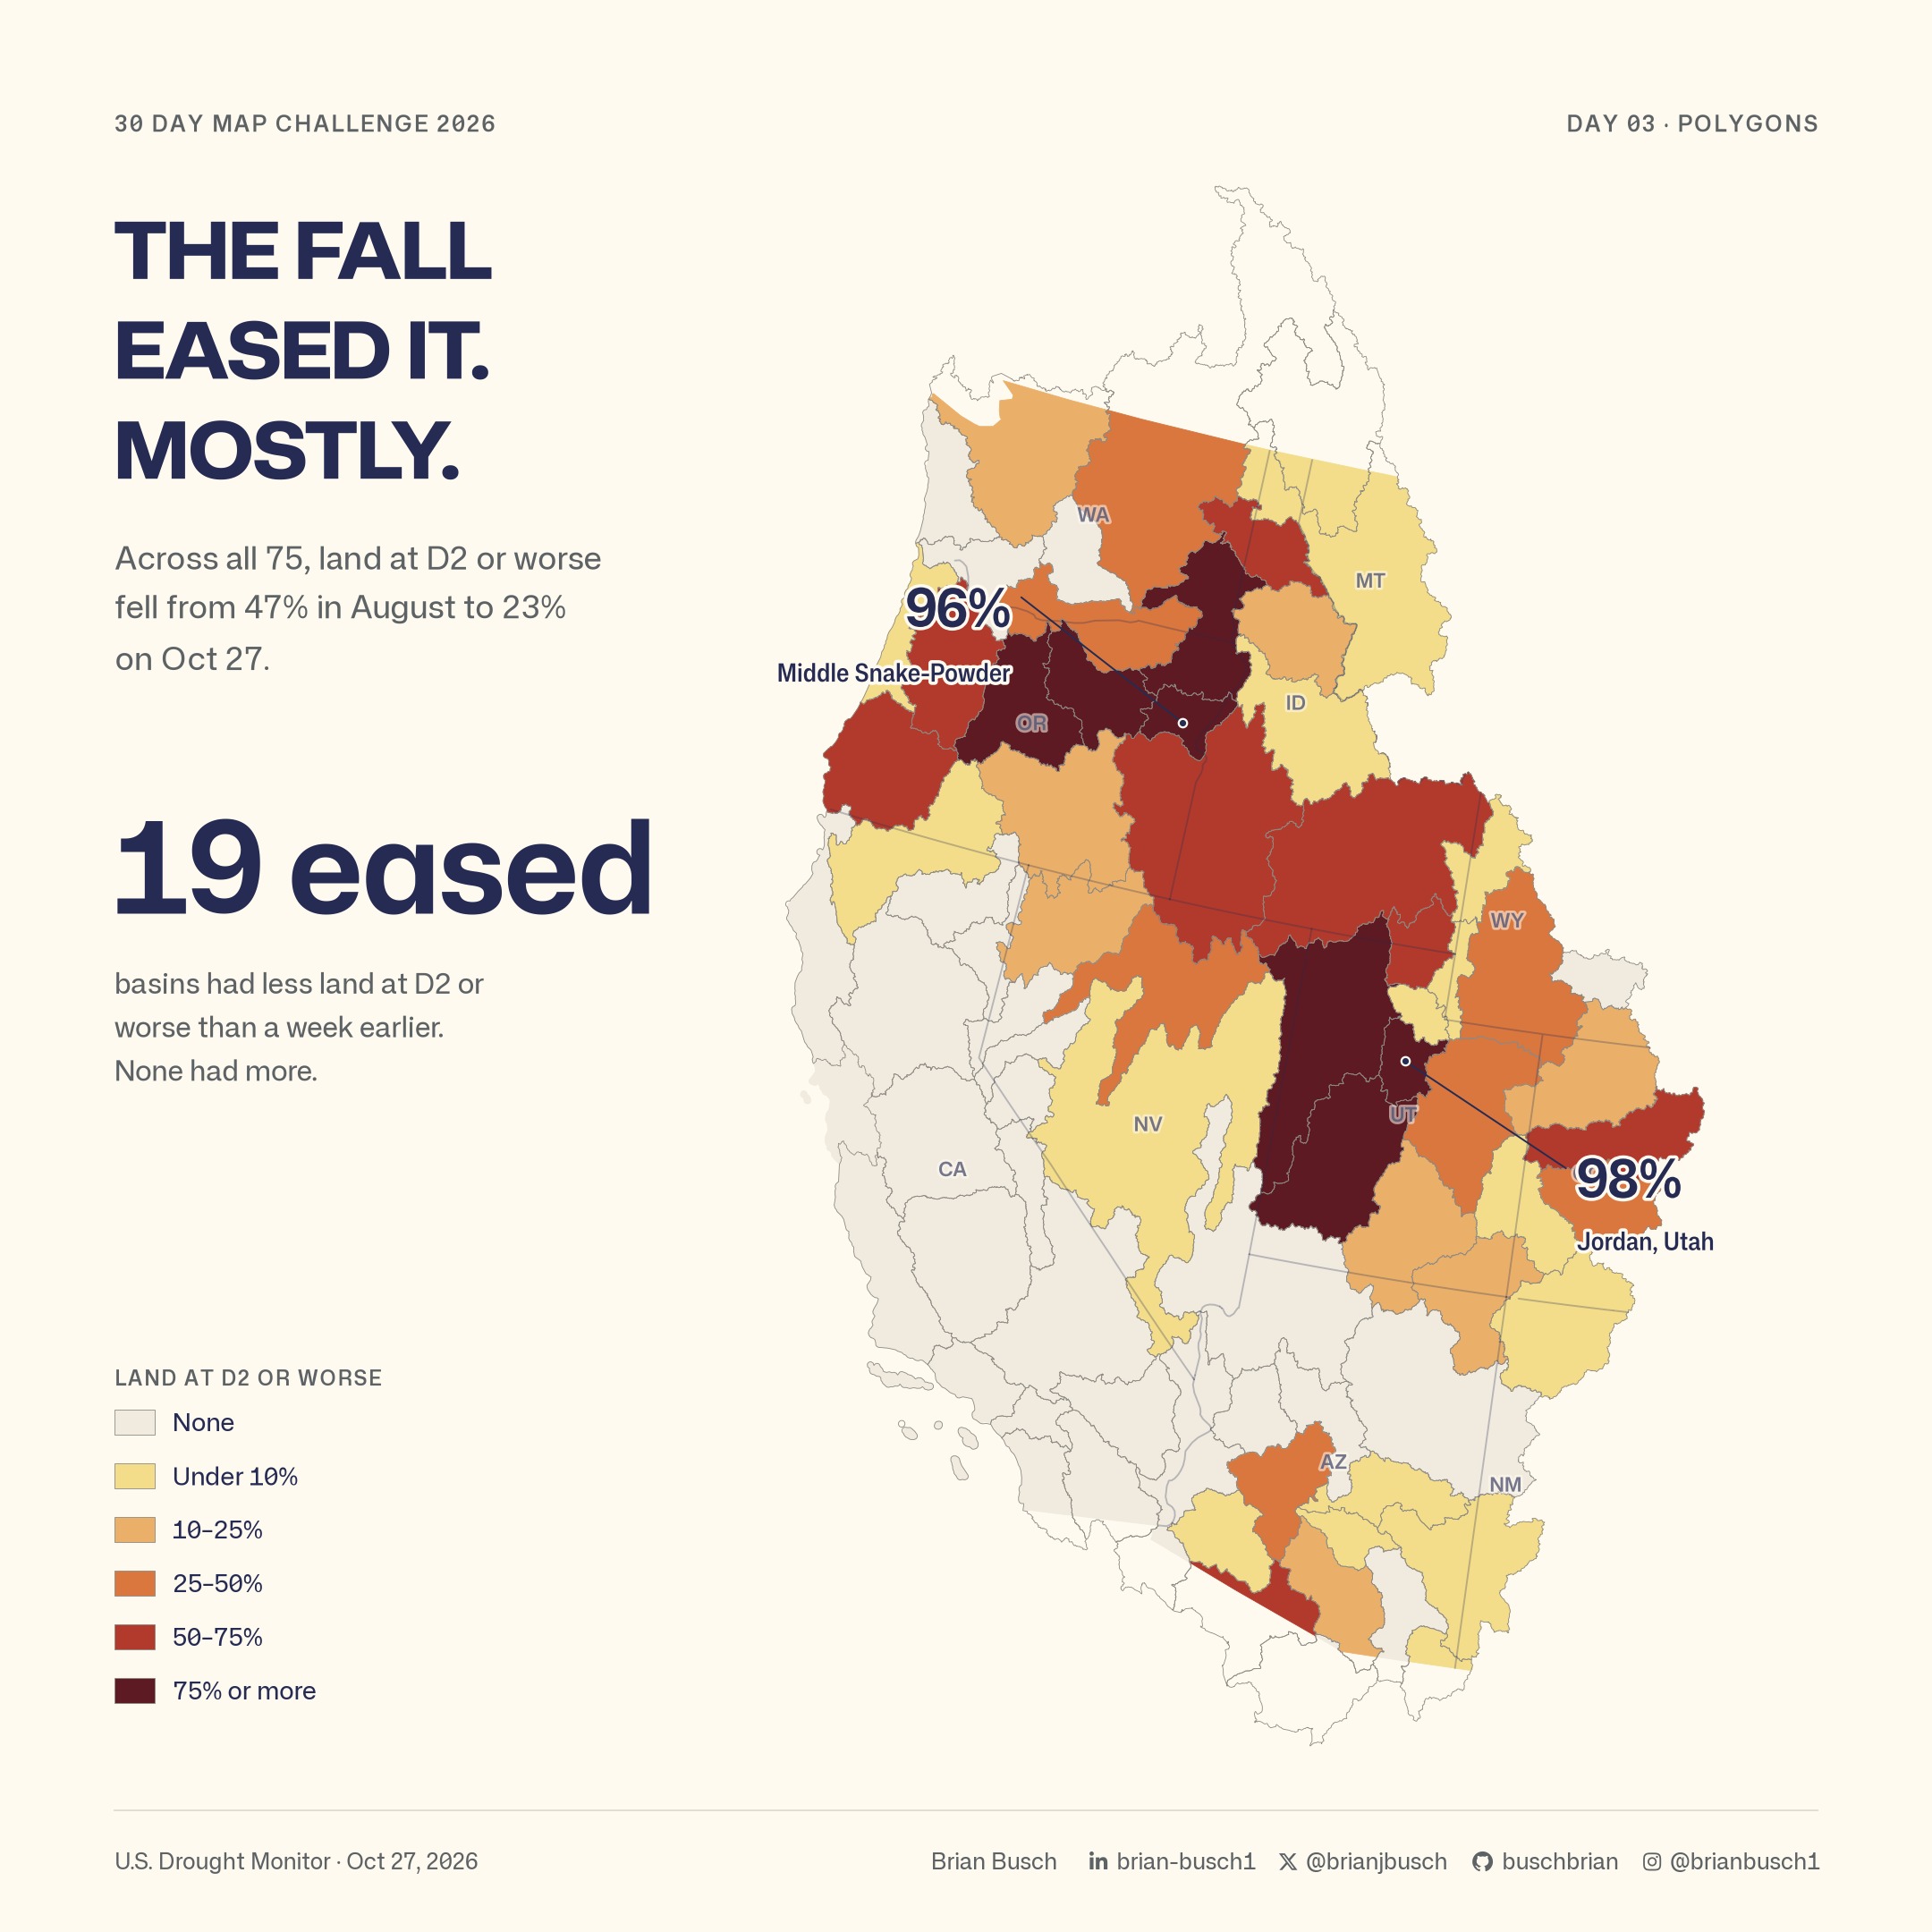
Some basins did not move much. The Jordan basin in Utah is at 98%. Middle Snake-Powder, on the Oregon and Idaho border, is at 96%. Fifteen basins are at 50% or more.
Symbol guide
- Thin outlines mark the HUC-6 basins. Basins that cross into Canada show only their U.S. land in color.
- The first scene uses the Drought Monitor classes, from pale yellow for D0 to dark red for D4.
- The other scenes use six classes for the share of land at D2 or worse, from none to 75% or more.
- All maps use an equal-area projection, so basin sizes compare fairly.
Method
- The drought polygons come from the U.S. Drought Monitor, through a fixed snapshot of the Western Water Dashboard’s drought data.
- The basins are the 75 HUC-6 units in hydrologic regions 14 through 18, from the USGS Watershed Boundary Dataset. Only U.S. land is colored.
- The maps use the Contiguous USA Albers equal-area projection (EPSG:5070), so basin areas compare fairly.
- Each basin’s value is its share of land at D2 or worse. The West-wide share weights each basin by its U.S. land area.
- Two weeks in February 2026 are missing from the Drought Monitor archive. The maps leave them missing.
Data and credit
The National Drought Mitigation Center, USDA and NOAA produce the U.S. Drought Monitor. USGS provides the Watershed Boundary Dataset. The state lines come from Natural Earth. The Western Water Dashboard measures the share of each basin in each class.