Lake Mead and Lake Powell
The first scene plots the surface elevation of the two largest reservoirs on the Colorado River. Lake Mead has daily records since February 1935. Lake Powell has daily records since December 1963. The Bureau of Reclamation publishes both records.
Both lakes peaked in July 1983. Both set new lows this fall.

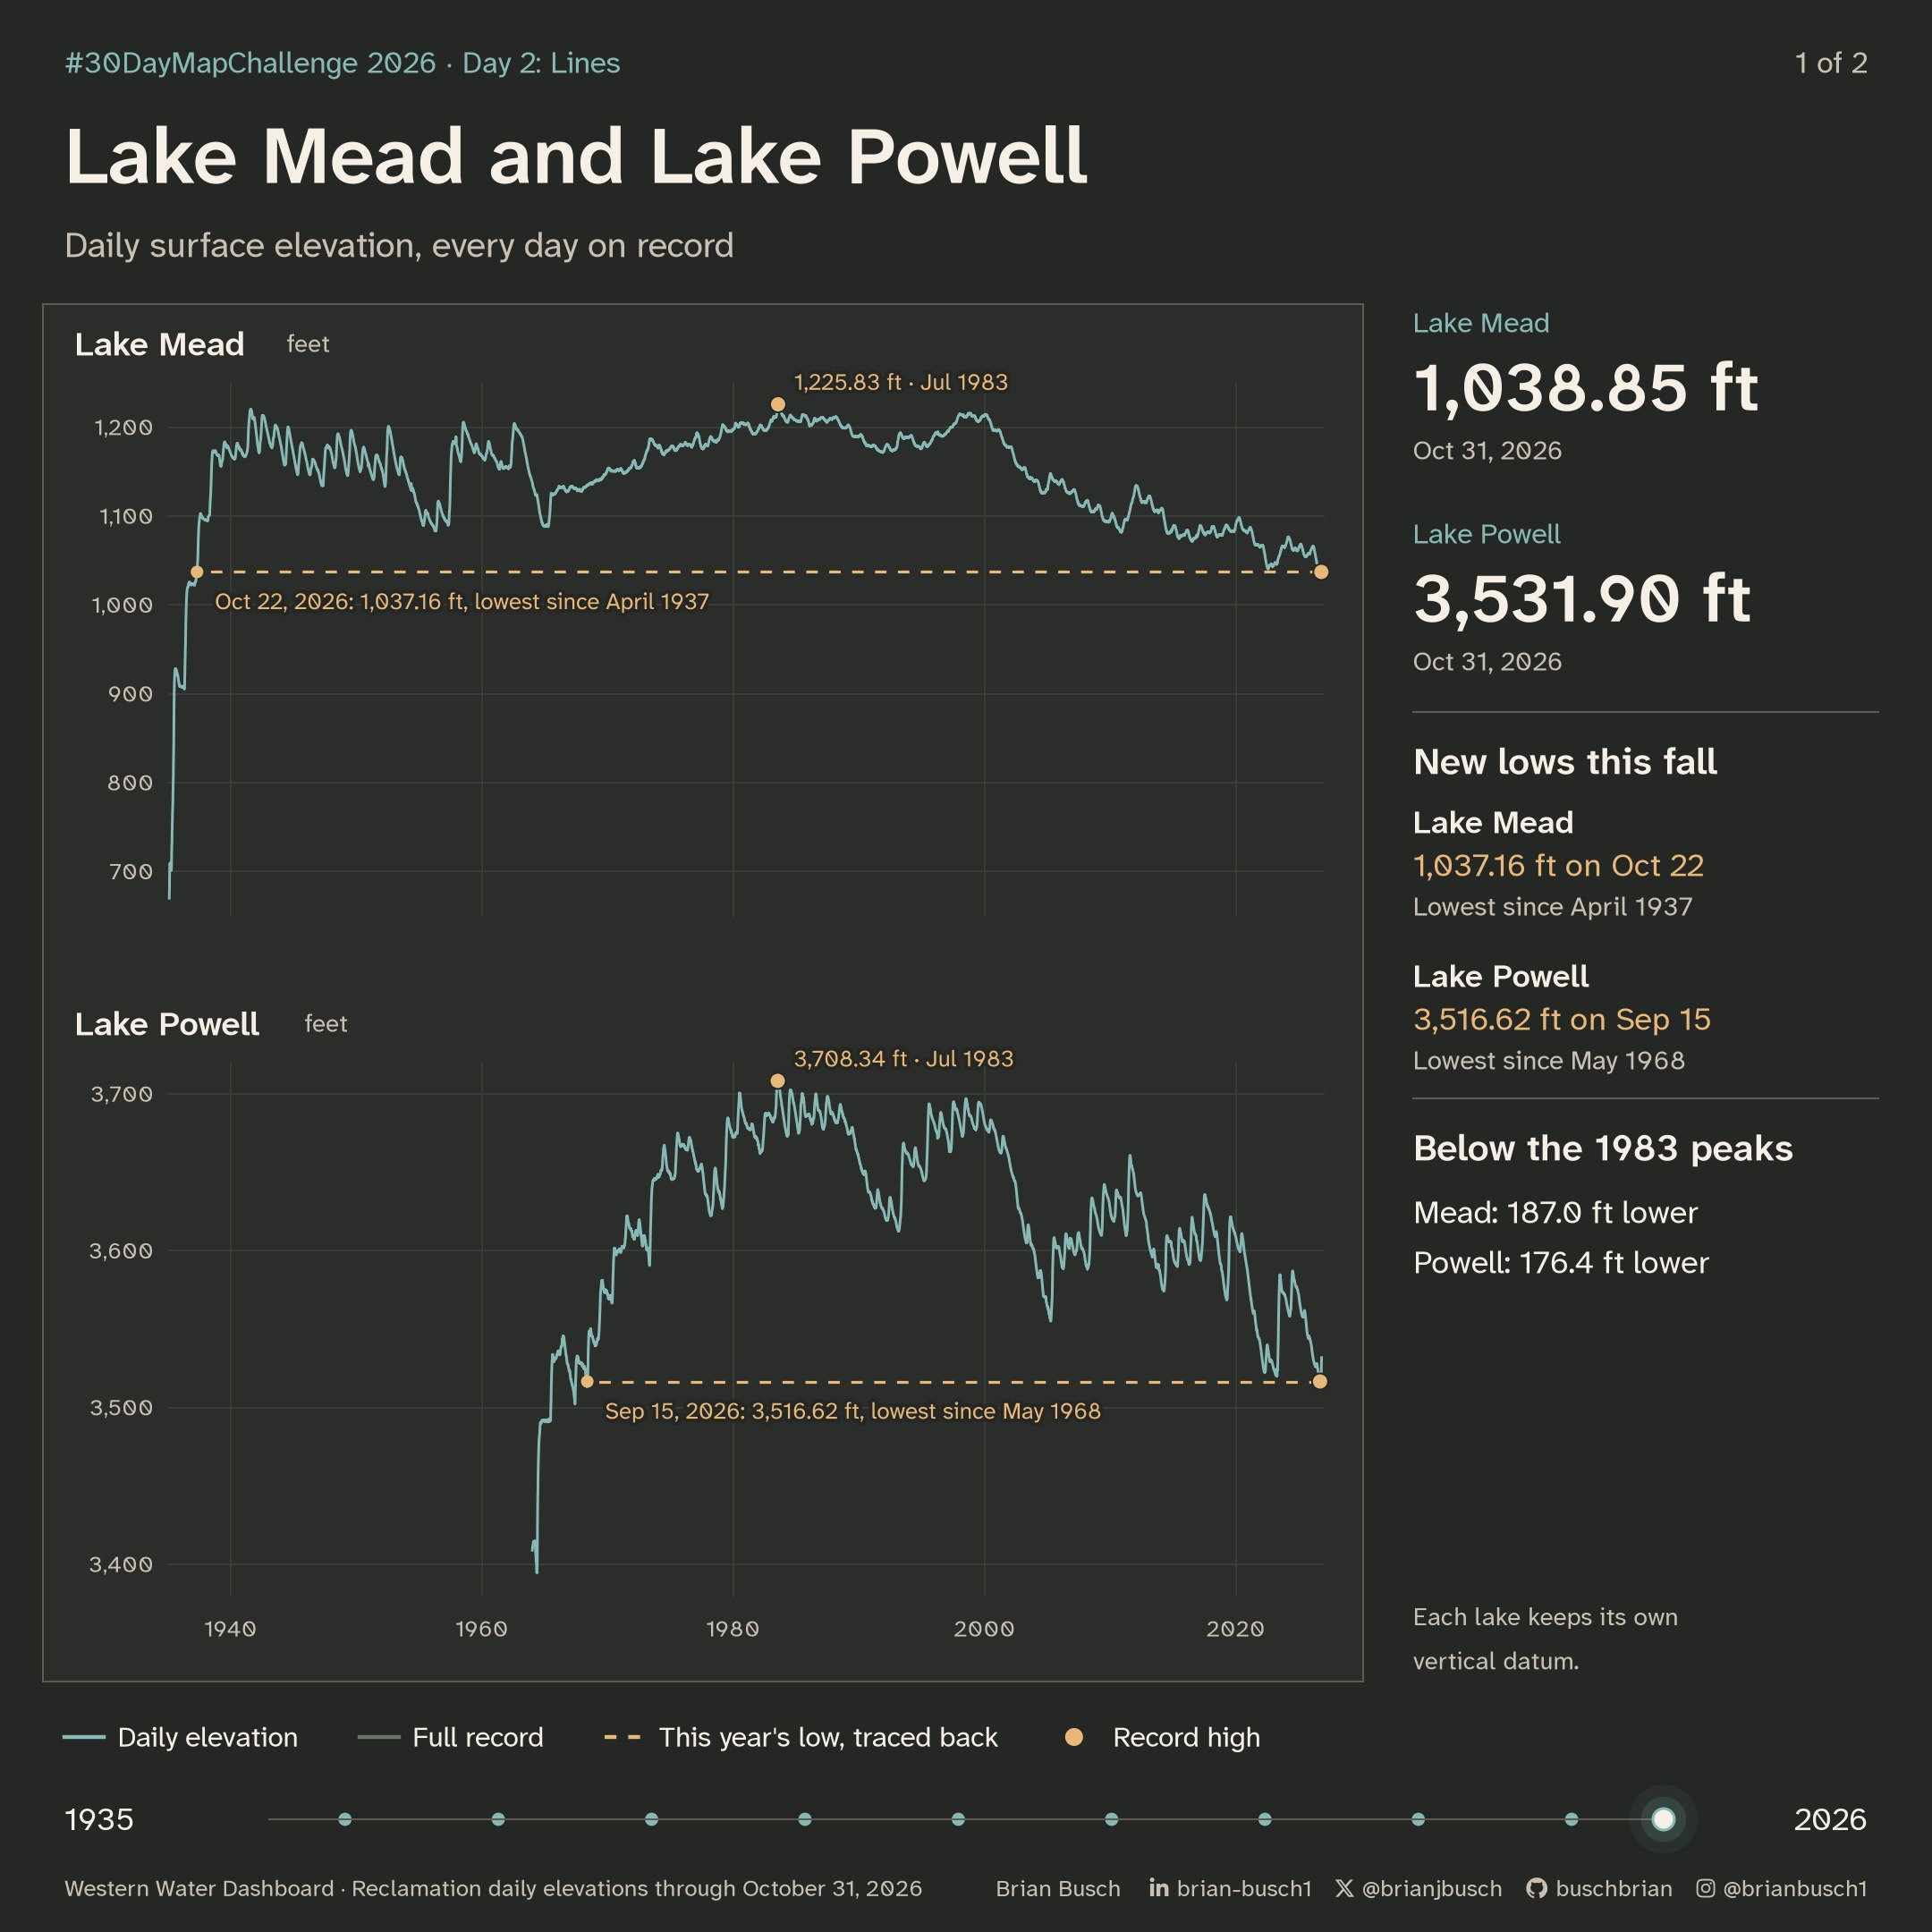
Lake Mead reached 1,037.16 feet on October 22, 2026. That is its lowest level since April 1937, when the lake was still filling. Lake Powell reached 3,516.62 feet on September 15, 2026. That is its lowest level since May 1968.
On October 31, Lake Mead was 187 feet below its 1983 peak. Lake Powell was 176 feet below its peak.
| Lake | 1983 peak | 2026 low | Last this low | October 31, 2026 |
|---|---|---|---|---|
| Lake Mead | 1,225.83 Jul 24 | 1,037.16 Oct 22 | Apr 20, 1937 | 1,038.85 |
| Lake Powell | 3,708.34 Jul 14 | 3,516.62 Sep 15 | May 15, 1968 | 3,531.90 |
Below the earlier record lows
Before this year, Lake Mead’s lowest level since it filled was 1,040.58 feet, on July 28, 2022. In 2026 it was below that level on 87 days, between August 6 and October 31.
Lake Powell’s earlier low was 3,519.92 feet, on April 13, 2023. In 2026 it was below that level on 62 days, between August 15 and October 15.
| Year | Lake Mead | Lake Powell |
|---|---|---|
| 2019 | 1,081.56 | 3,568.51 |
| 2020 | 1,081.04 | 3,582.21 |
| 2021 | 1,064.91 | 3,537.33 |
| 2022 | 1,040.58 | 3,522.24 |
| 2023 | 1,044.91 | 3,519.92 |
| 2024 | 1,060.83 | 3,558.21 |
| 2025 | 1,054.07 | 3,540.31 |
| 2026 (to Oct 31) | 1,037.16 | 3,516.62 |
How the lake scene is drawn
- Lake Mead has 33,510 daily values, from February 2, 1935, through October 31, 2026. Lake Powell has 22,954 daily values, from December 28, 1963. Neither record has gaps.
- Each lake keeps its own vertical datum and its own vertical scale. Lake Mead uses the project datum. Lake Powell uses NGVD 29.
- The lines draw from the first record to the last. A bright point leads each line as it draws.
- After the lines finish, a dashed line traces each 2026 low back to the last date the lake was that low. A ripple marks both ends.
Two reservoir systems as diagrams
The second scene does not use a map. Each reservoir in the Colorado and Columbia systems is a circle. Circle size shows capacity. The fill shows the share stored each month, from November 2025 through September 2026.
Lines join each reservoir to the next represented reservoir downstream. The links come from U.S. Geological Survey Network-Linked Data Index traces. They show inferred drainage. They do not follow river paths or show managed water transfers.
The Colorado system has 77 reservoirs and the Columbia system has 76. Combined storage uses the reservoirs with complete records: 76 in the Colorado system and 73 in the Columbia.
The Colorado system peaked at 36.6% in January. It fell every month after that, to 29.6% in September. The Columbia system rose to 83.0% in June and fell to 69.9% in September.

| Month | Colorado system | Columbia system |
|---|---|---|
| November 2025 | 36.4% | 71.5% |
| December 2025 | 36.5% | 74.4% |
| January 2026 | 36.6% | 73.3% |
| February 2026 | 36.3% | 71.4% |
| March 2026 | 35.9% | 70.6% |
| April 2026 | 35.4% | 72.2% |
| May 2026 | 34.4% | 78.1% |
| June 2026 | 33.5% | 83.0% |
| July 2026 | 32.0% | 80.1% |
| August 2026 | 30.7% | 73.5% |
| September 2026 | 29.6% | 69.9% |
The longest chain
The amber line is the longest chain in the network. It joins 12 reservoirs, from Jackson Lake in Wyoming to Lake Celilo on the Columbia River.
- Jackson Lake
- Palisades Reservoir
- American Falls Reservoir
- Lake Walcott
- Hells Canyon Reservoir
- Lower Granite Lake
- Lake Bryan
- Lake Herbert G. West
- Lake Sacajawea
- Lake Wallula
- Lake Umatilla
- Lake Celilo
How the diagrams are drawn
- Each system is a tree. Its outlet sits at the bottom: Lake Mohave for the Colorado, and Lake Celilo for the Columbia.
- Each reservoir sits one level above the next represented reservoir downstream.
- At each reservoir, the upstream branch with the most total capacity continues straight up. This makes the main stem easy to follow. Smaller branches alternate to the left and right.
- Circle area follows capacity. The fill rises like water in a gauge, the same way as the Day 1 storage map.
- Labels name the five largest reservoirs in each system, the outlet, and the start of the longest chain.
- Storage moves from one monthly mean to the next.
Data notes
- The links connect reservoirs in the dataset only. Reservoirs outside the dataset can sit between two linked reservoirs.
- A link means that one reservoir’s traced drainage area contains the other. It does not show a canal, a pipeline, or a managed transfer.
- Combined storage uses only the reservoirs with all 11 monthly values: 76 of 77 in the Colorado system and 73 of 76 in the Columbia.
- The Colorado system holds 66.3 million acre-feet of capacity. The Columbia system holds 42.5 million acre-feet.
Sources
Lake elevations come from Bureau of Reclamation daily records, through the Western Water Dashboard. Read the elevation data.
Storage comes from nine public providers. The links come from U.S. Geological Survey Network-Linked Data Index traces. Read the trace data.
Open Lake Celilo’s upstream view.
The figures use fixed data snapshots. Download the figure data.