Every recorded start
The Fire Program Analysis fire-occurrence database (FPA FOD) records wildfire starts across the United States. Its 7th edition covers 1992 to 2024. Inside Utah's boundary it holds 41,117 records.
Natural causes account for 54% of those records. People caused 38%. The other 8% have no cause recorded, so neither panel shows them. Across 75 western drainage basins, natural causes account for 32% of starts. Utah reverses the western pattern.

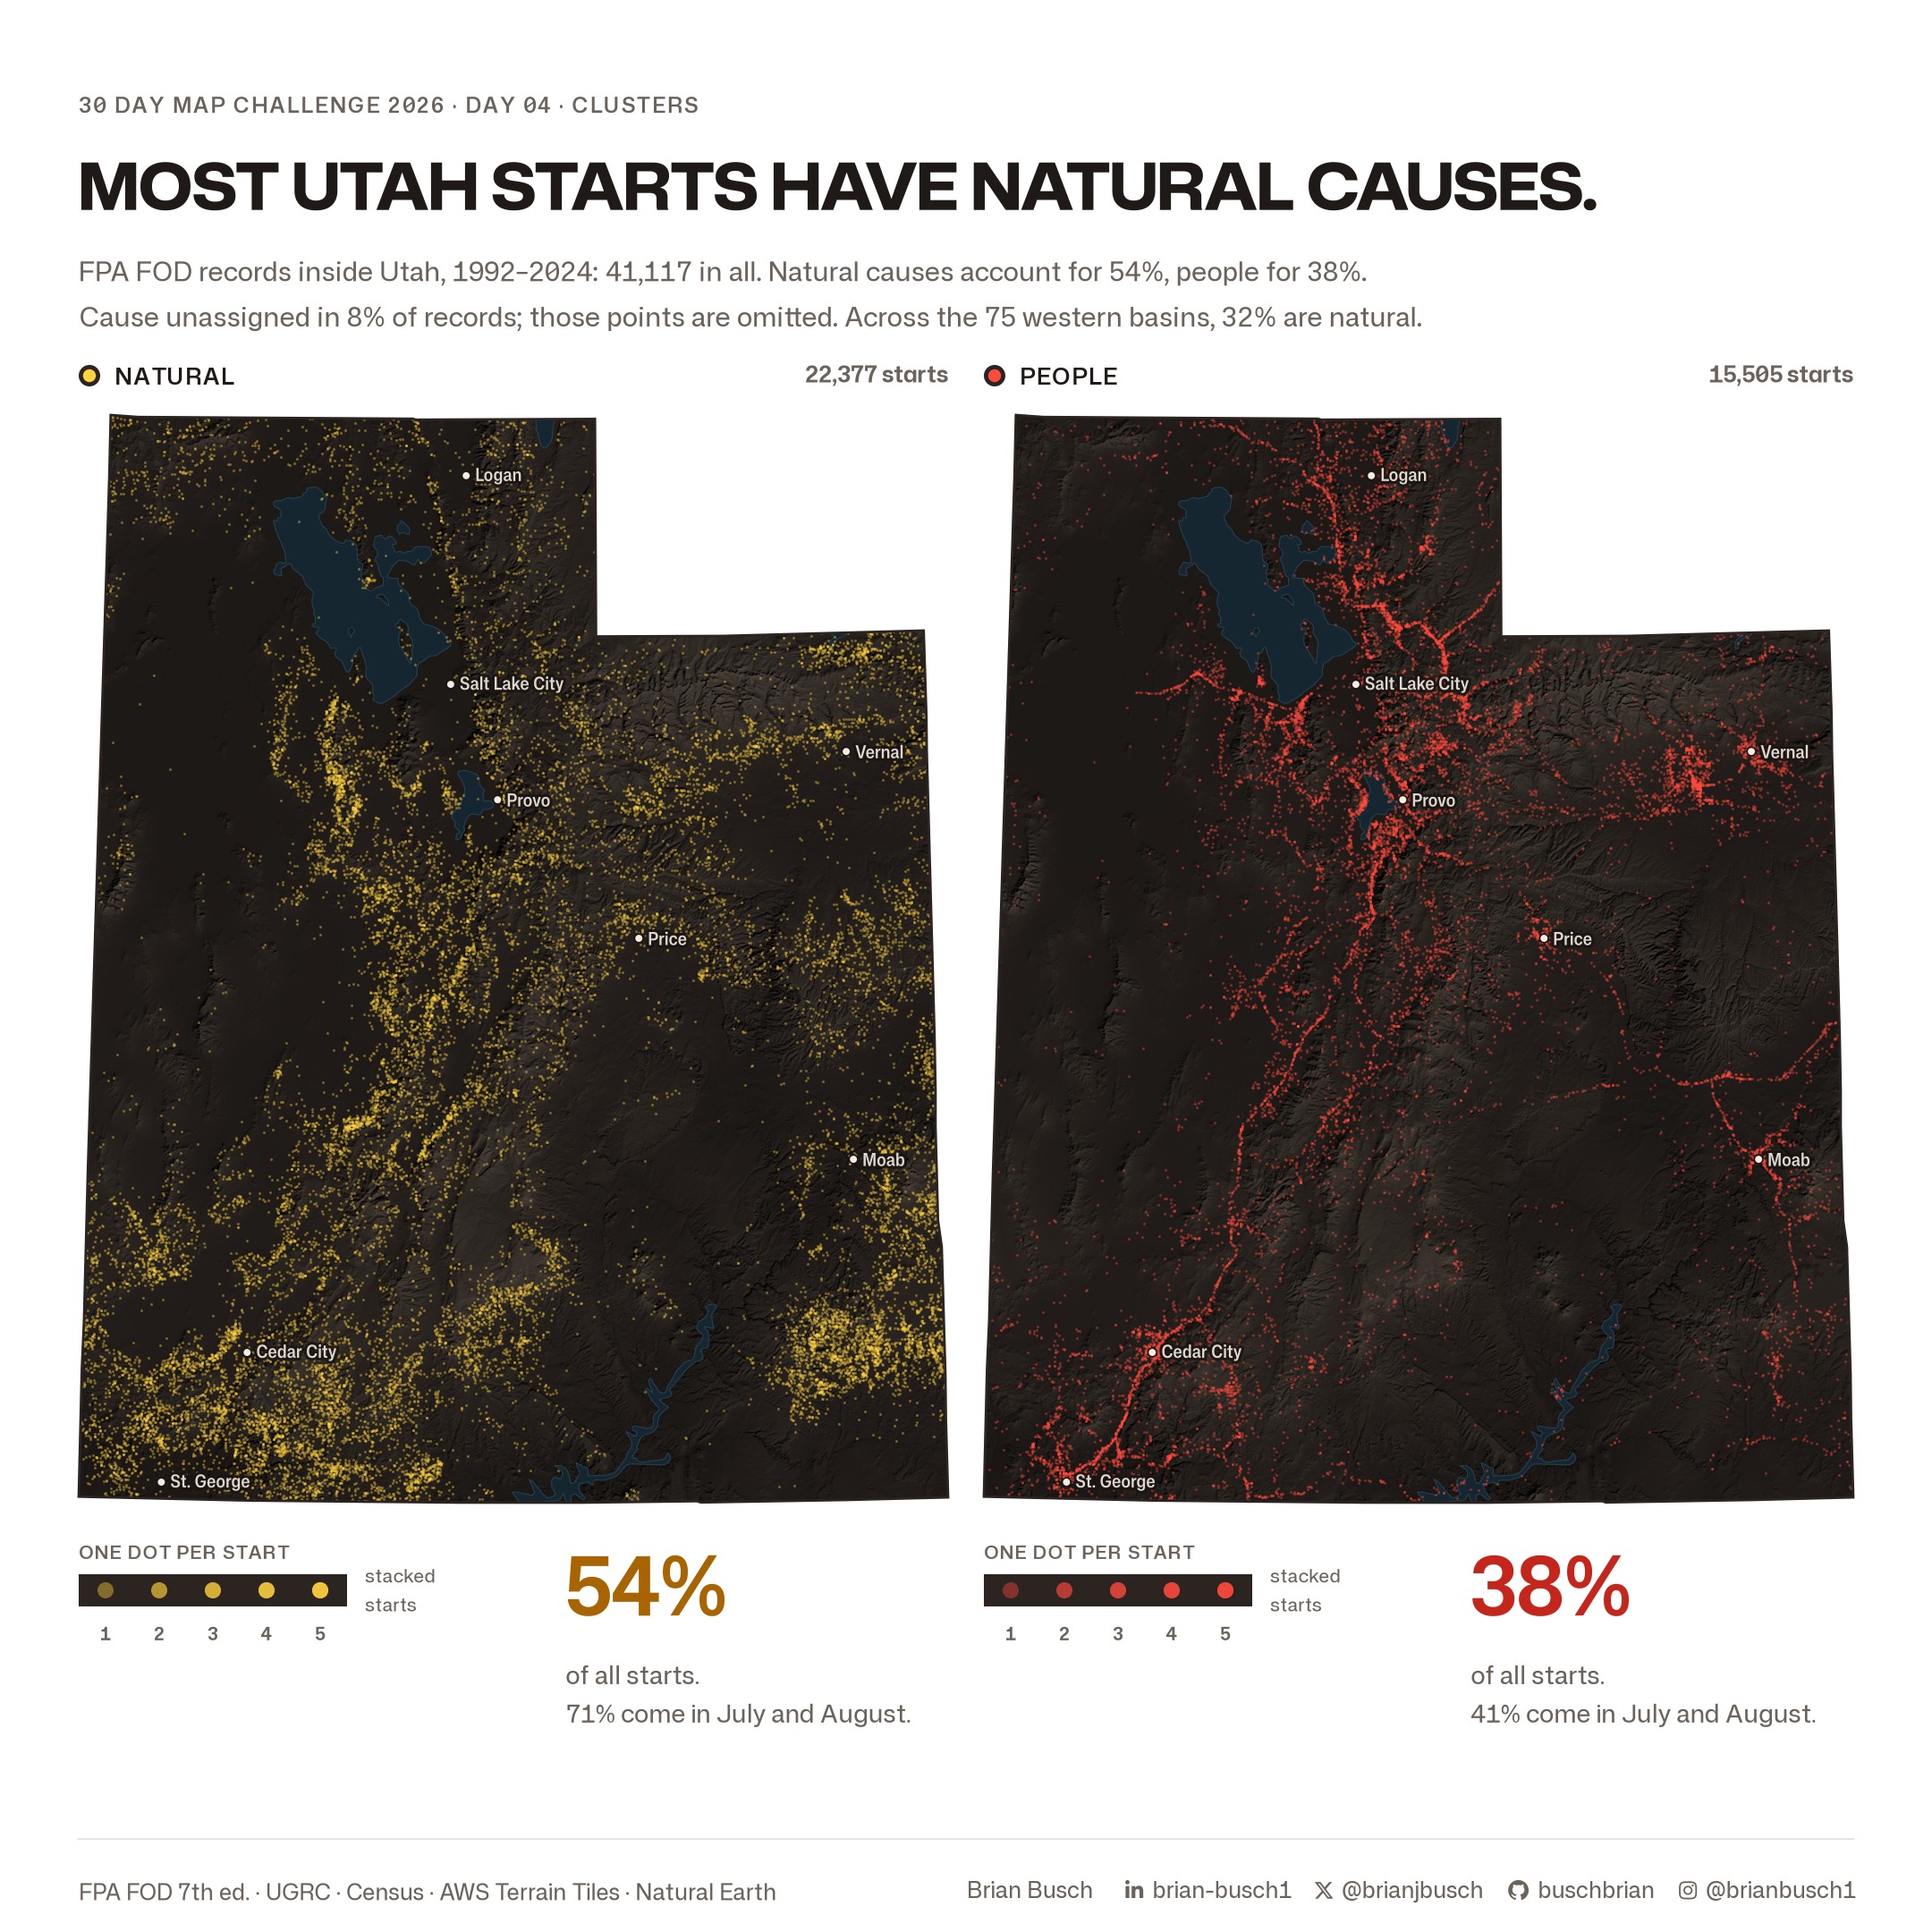
The database calls the first group Natural. That group is broader than lightning, so this page does not call it lightning.
From dots to density
Dots stack up where starts are common. A density surface shows the same pattern more clearly. Kernel density spreads each start over the land around it. Here each start spreads with a Gaussian kernel, 5 km wide, on a 1 km grid.
Both causes use one log scale, in starts per 1,000 km² per year. The colors compare directly across the two panels.

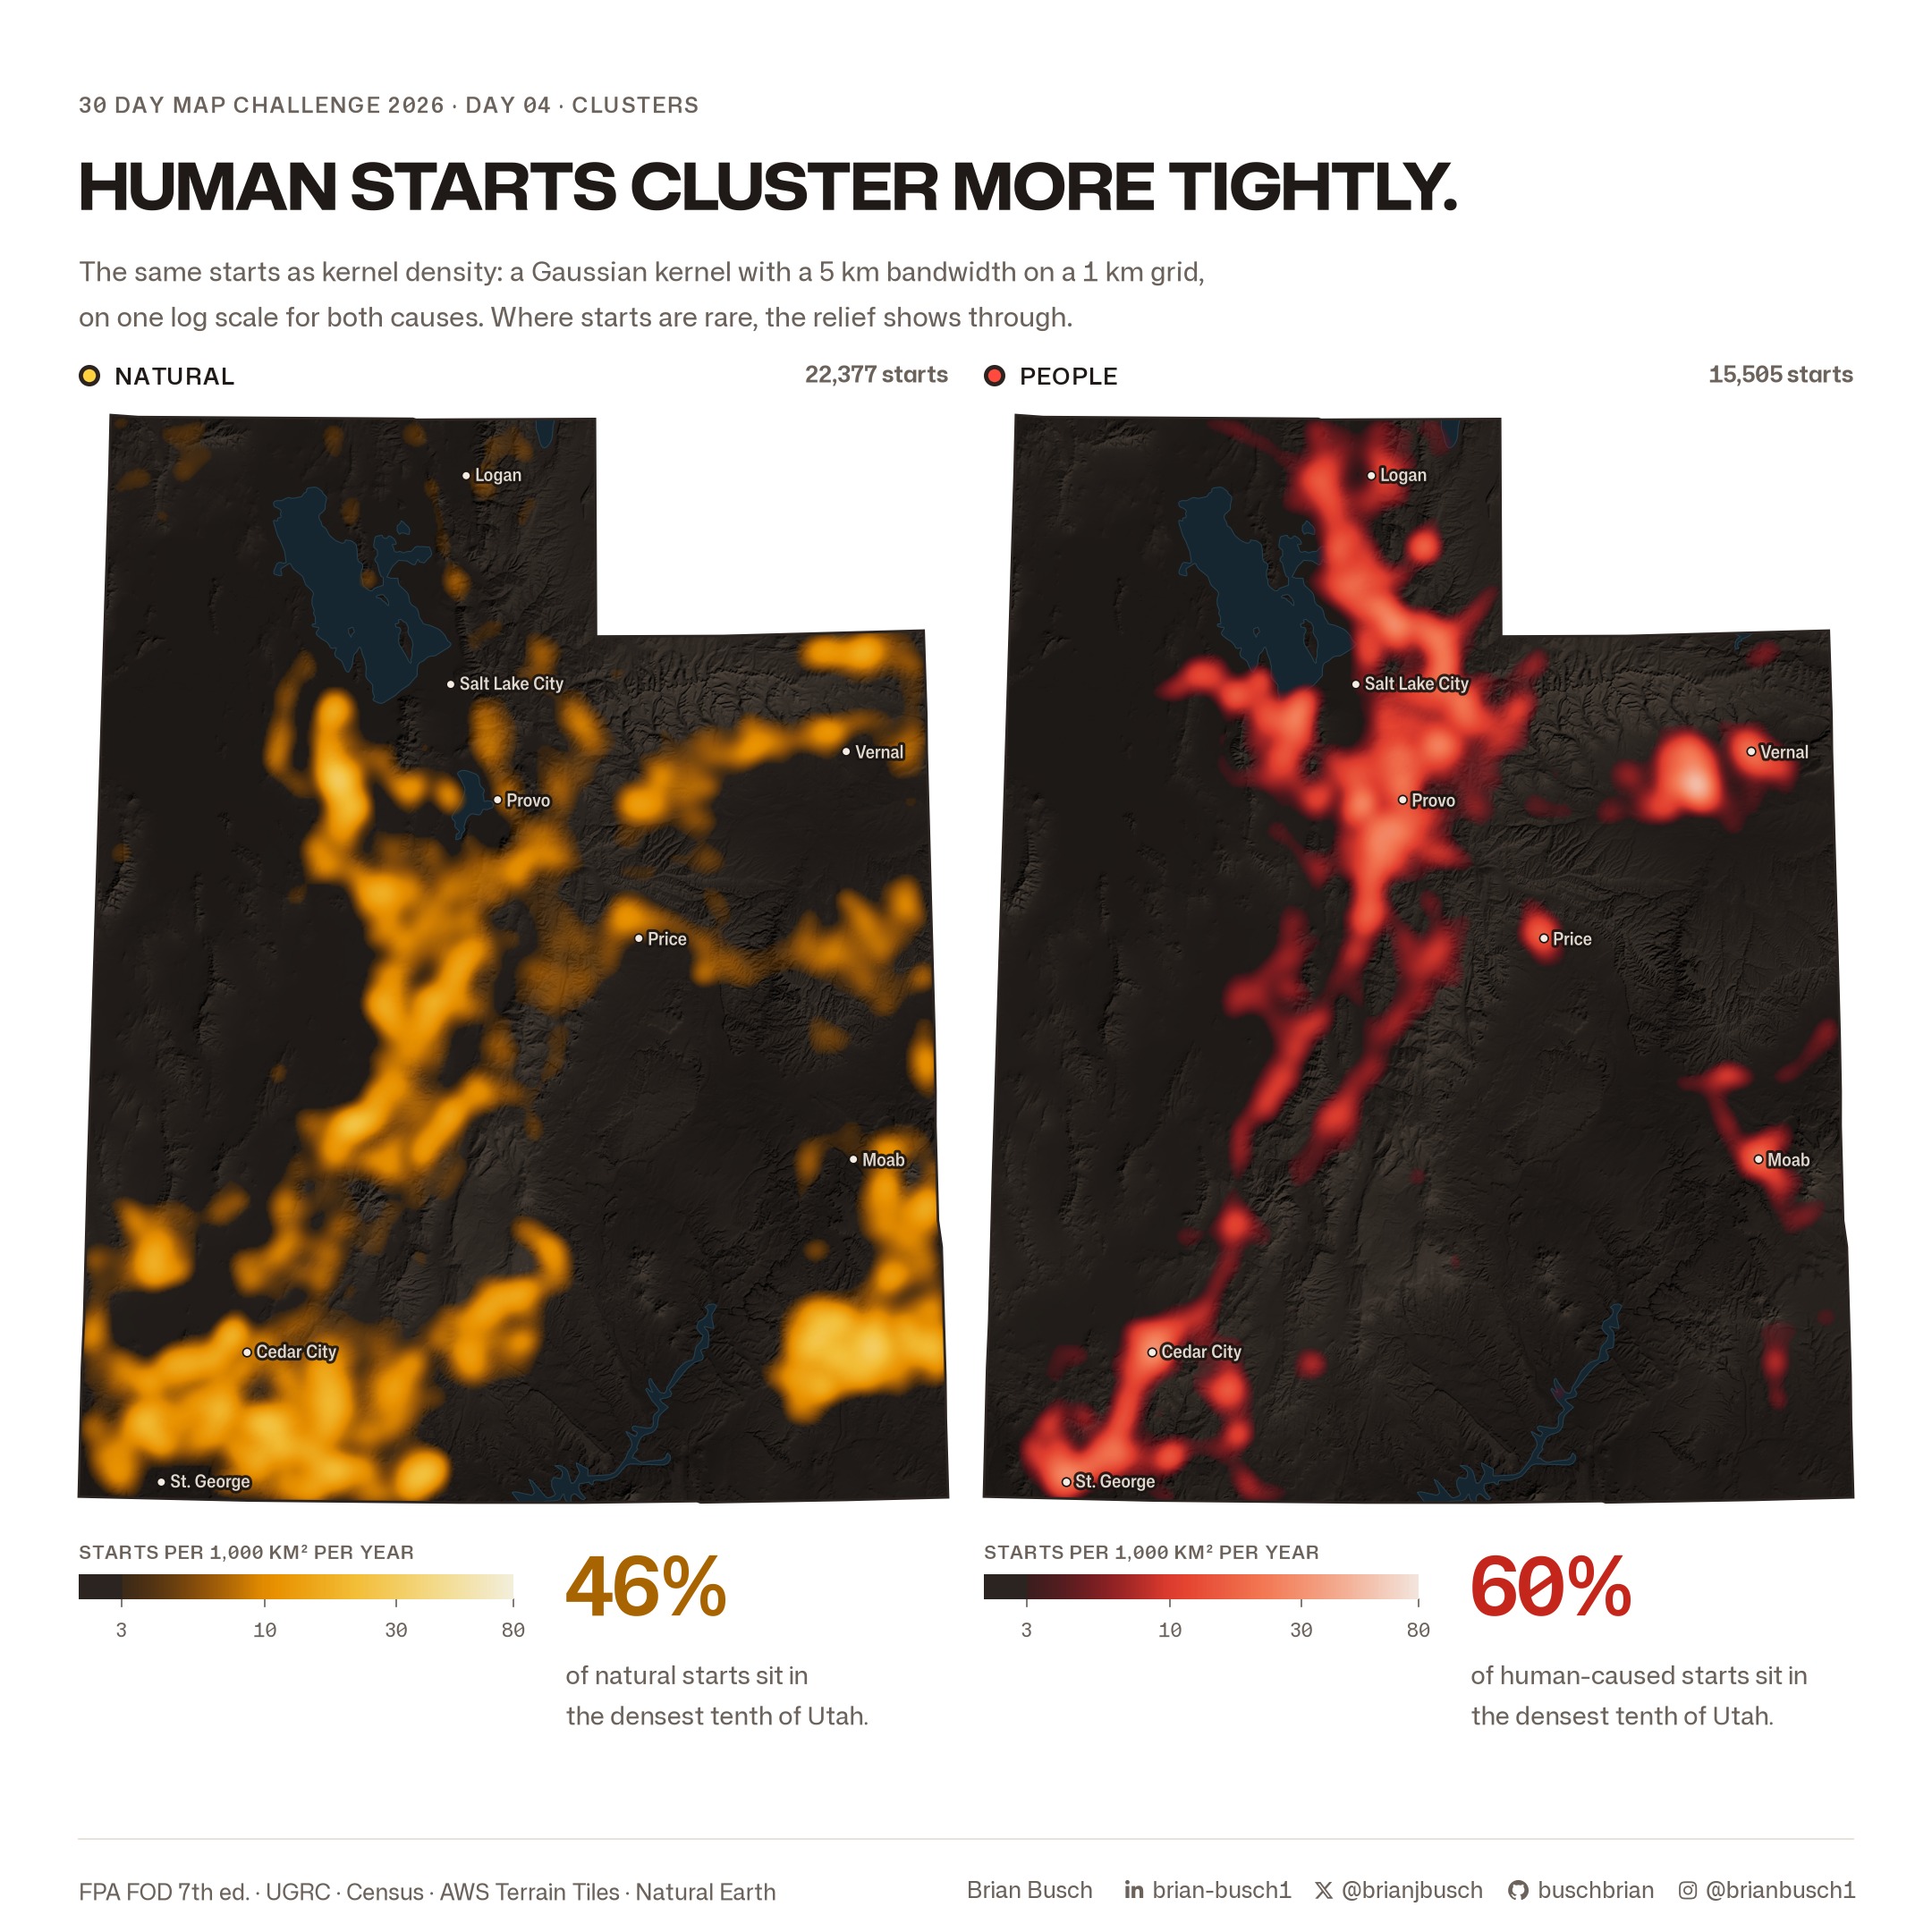
Each cause has its own densest tenth of Utah's land. That tenth holds 60% of human-caused starts and 46% of natural starts. Human-caused starts follow the Wasatch Front, I-15 and towns. Natural starts spread over the plateaus and mountains.
Where they meet
The last scene blends both surfaces on one map. Yellow marks dense natural starts. Red marks dense human-caused starts. Pale peach marks land where both are dense.

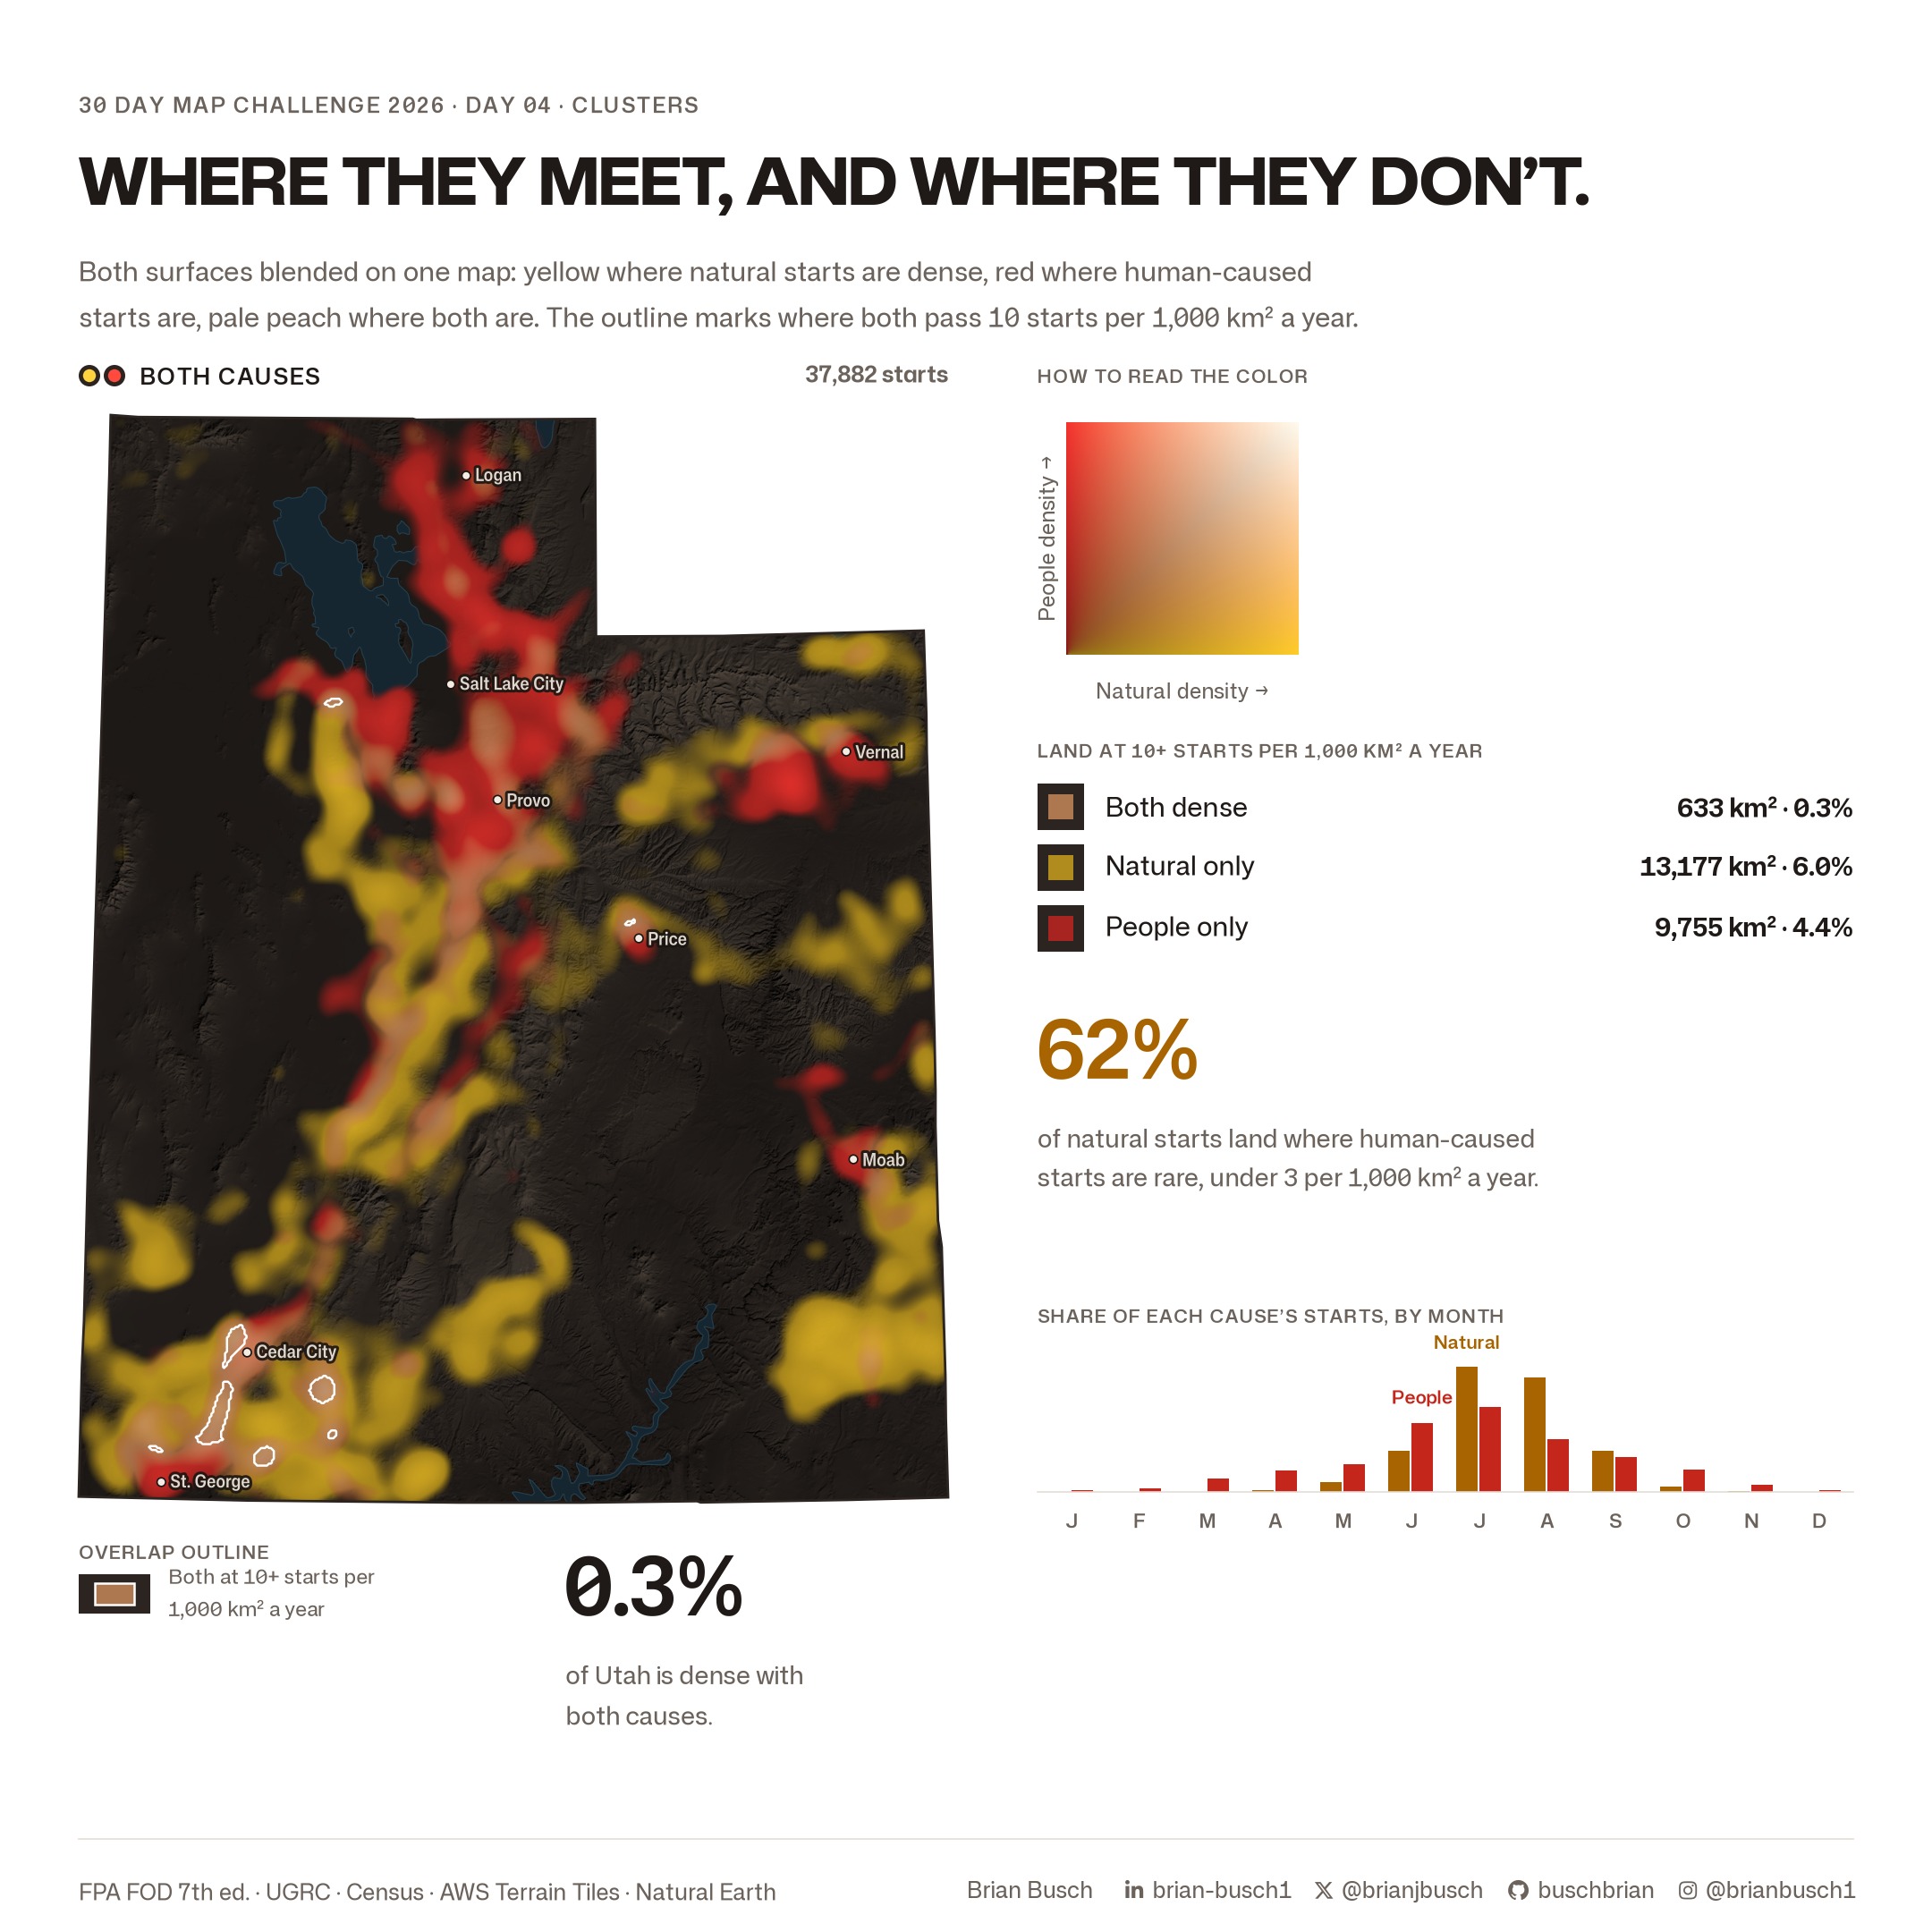
Both surfaces reach 10 starts per 1,000 km² per year on 633 km², 0.3% of Utah. Natural starts alone reach it on 6.0% of the state. Human-caused starts alone reach it on 4.4%.
62% of natural starts land where human-caused starts are rare, under 3 per 1,000 km² per year. Natural starts also peak harder in summer. July and August hold 71% of natural starts and 41% of human-caused starts.
Explore the starts
The interactive map draws the same 37,882 starts with a known cause. Filter them by cause and by year. Show them as clusters, as a density surface, or as single dots.
Symbol guide
- Yellow is natural causes. Red is human causes.
- The density ramps run from dark at 3 starts per 1,000 km² per year to pale at 80 or more.
- The two-way key on the combined map reads natural density across and human density up.
- White outlines mark land where both surfaces reach 10 starts per 1,000 km² per year.
- The basemap is shaded relief with lakes, highways and town labels.
Method
- The fire records are FPA FOD, 7th edition, clipped to the UGRC Utah boundary.
- The cause groups use the database's cause classification: natural, human, or missing.
- The maps use an Albers equal-area projection centered on Utah, so areas compare fairly.
- Density uses a Gaussian kernel with a 5 km bandwidth on a 1 km grid, divided by the 33 years of record.
- Each cause's densest tenth is measured on its own surface. The two tenths are different areas.
- The relief is a multi-direction hillshade from AWS Terrain Tiles at zoom 9.
- The interactive map draws density in the browser with a 14 km kernel that ends at its edge. This kernel spreads each start as much as the 5 km Gaussian does. The land above each density threshold is within 6% of the stills.
Data notes
- The 41,117 total is a spatial clip to Utah. The database's own state field gives 41,133.
- Starts outside Utah are not in the data, so density near the state line reads low.
- The maps count starts. They do not show acres burned or future fire risk.
Data and credit
Karen C. Short compiles the FPA FOD for the USDA Forest Service Research Data Archive. UGRC provides the Utah boundary. The U.S. Census Bureau provides the town locations. The relief comes from AWS Terrain Tiles. The lakes and highways come from Natural Earth.