
A late view
The Canyon Overlook Trail is a walk of about 770 m to a viewpoint above Pine Creek. This map models the ground visible from 155 positions along the route.
In the bare-earth model, the ground visible in the first 500 m stays below a tenth of the overlook’s view. About two-thirds of the way along, a gap opens a window west to the West Temple and the Sundial. Then the rock closes in again.
Within the modeled area, nearly half the ground visible along the walk first appears in the final 15 m. That ground includes the canyon right below the viewpoint: Pine Creek and the highway switchbacks.
Watch the walk
A gold point follows the trail. Gold shows ground visible now; pale gold marks ground seen earlier. Red marks ground first visible in the final 15 m. A chart follows the amount of visible ground. The model excludes trees and buildings.
Read the narration transcript
On Zion’s Canyon Overlook Trail, rock hides most of the view.
A gap opens toward the West Temple, then closes again.
At the overlook, the canyon opens below.
In this bare-earth model, nearly half the ground visible along the trail first appears in the final fifteen meters.
How the model works
A viewshed is the area that is visible from one point. The model runs a viewshed every 5 m along the trail, 155 positions in all.
- The terrain is a digital elevation model (DEM), a grid of ground heights. The base is the USGS 3DEP 10 m DEM, resampled to 2 m cells.
- Near the viewpoint, the model uses 1 m lidar from a 2016 survey of Zion. Lidar is a laser survey flown from an aircraft.
- The coarser 10 m grid smooths the cliff below the viewpoint. The lidar preserves more of its shape.
- The elevation data is bare earth. It shows the ground with no trees or buildings.
- The trail line comes from the National Park Service's archived 2014 trail dataset. The eye sits 1.7 m above the lidar ground at each position.
- Each viewshed is limited to an 8 km radius.
- Each 2 m cell keeps the first distance along the walk at which it comes into view. Ground first in view in the last 15 m is "only at the rim."
From one viewpoint to the whole walk
The first version mapped only the view from the end of the trail. A ring around the map traced the skyline in every direction. It showed a view that opens to the west.

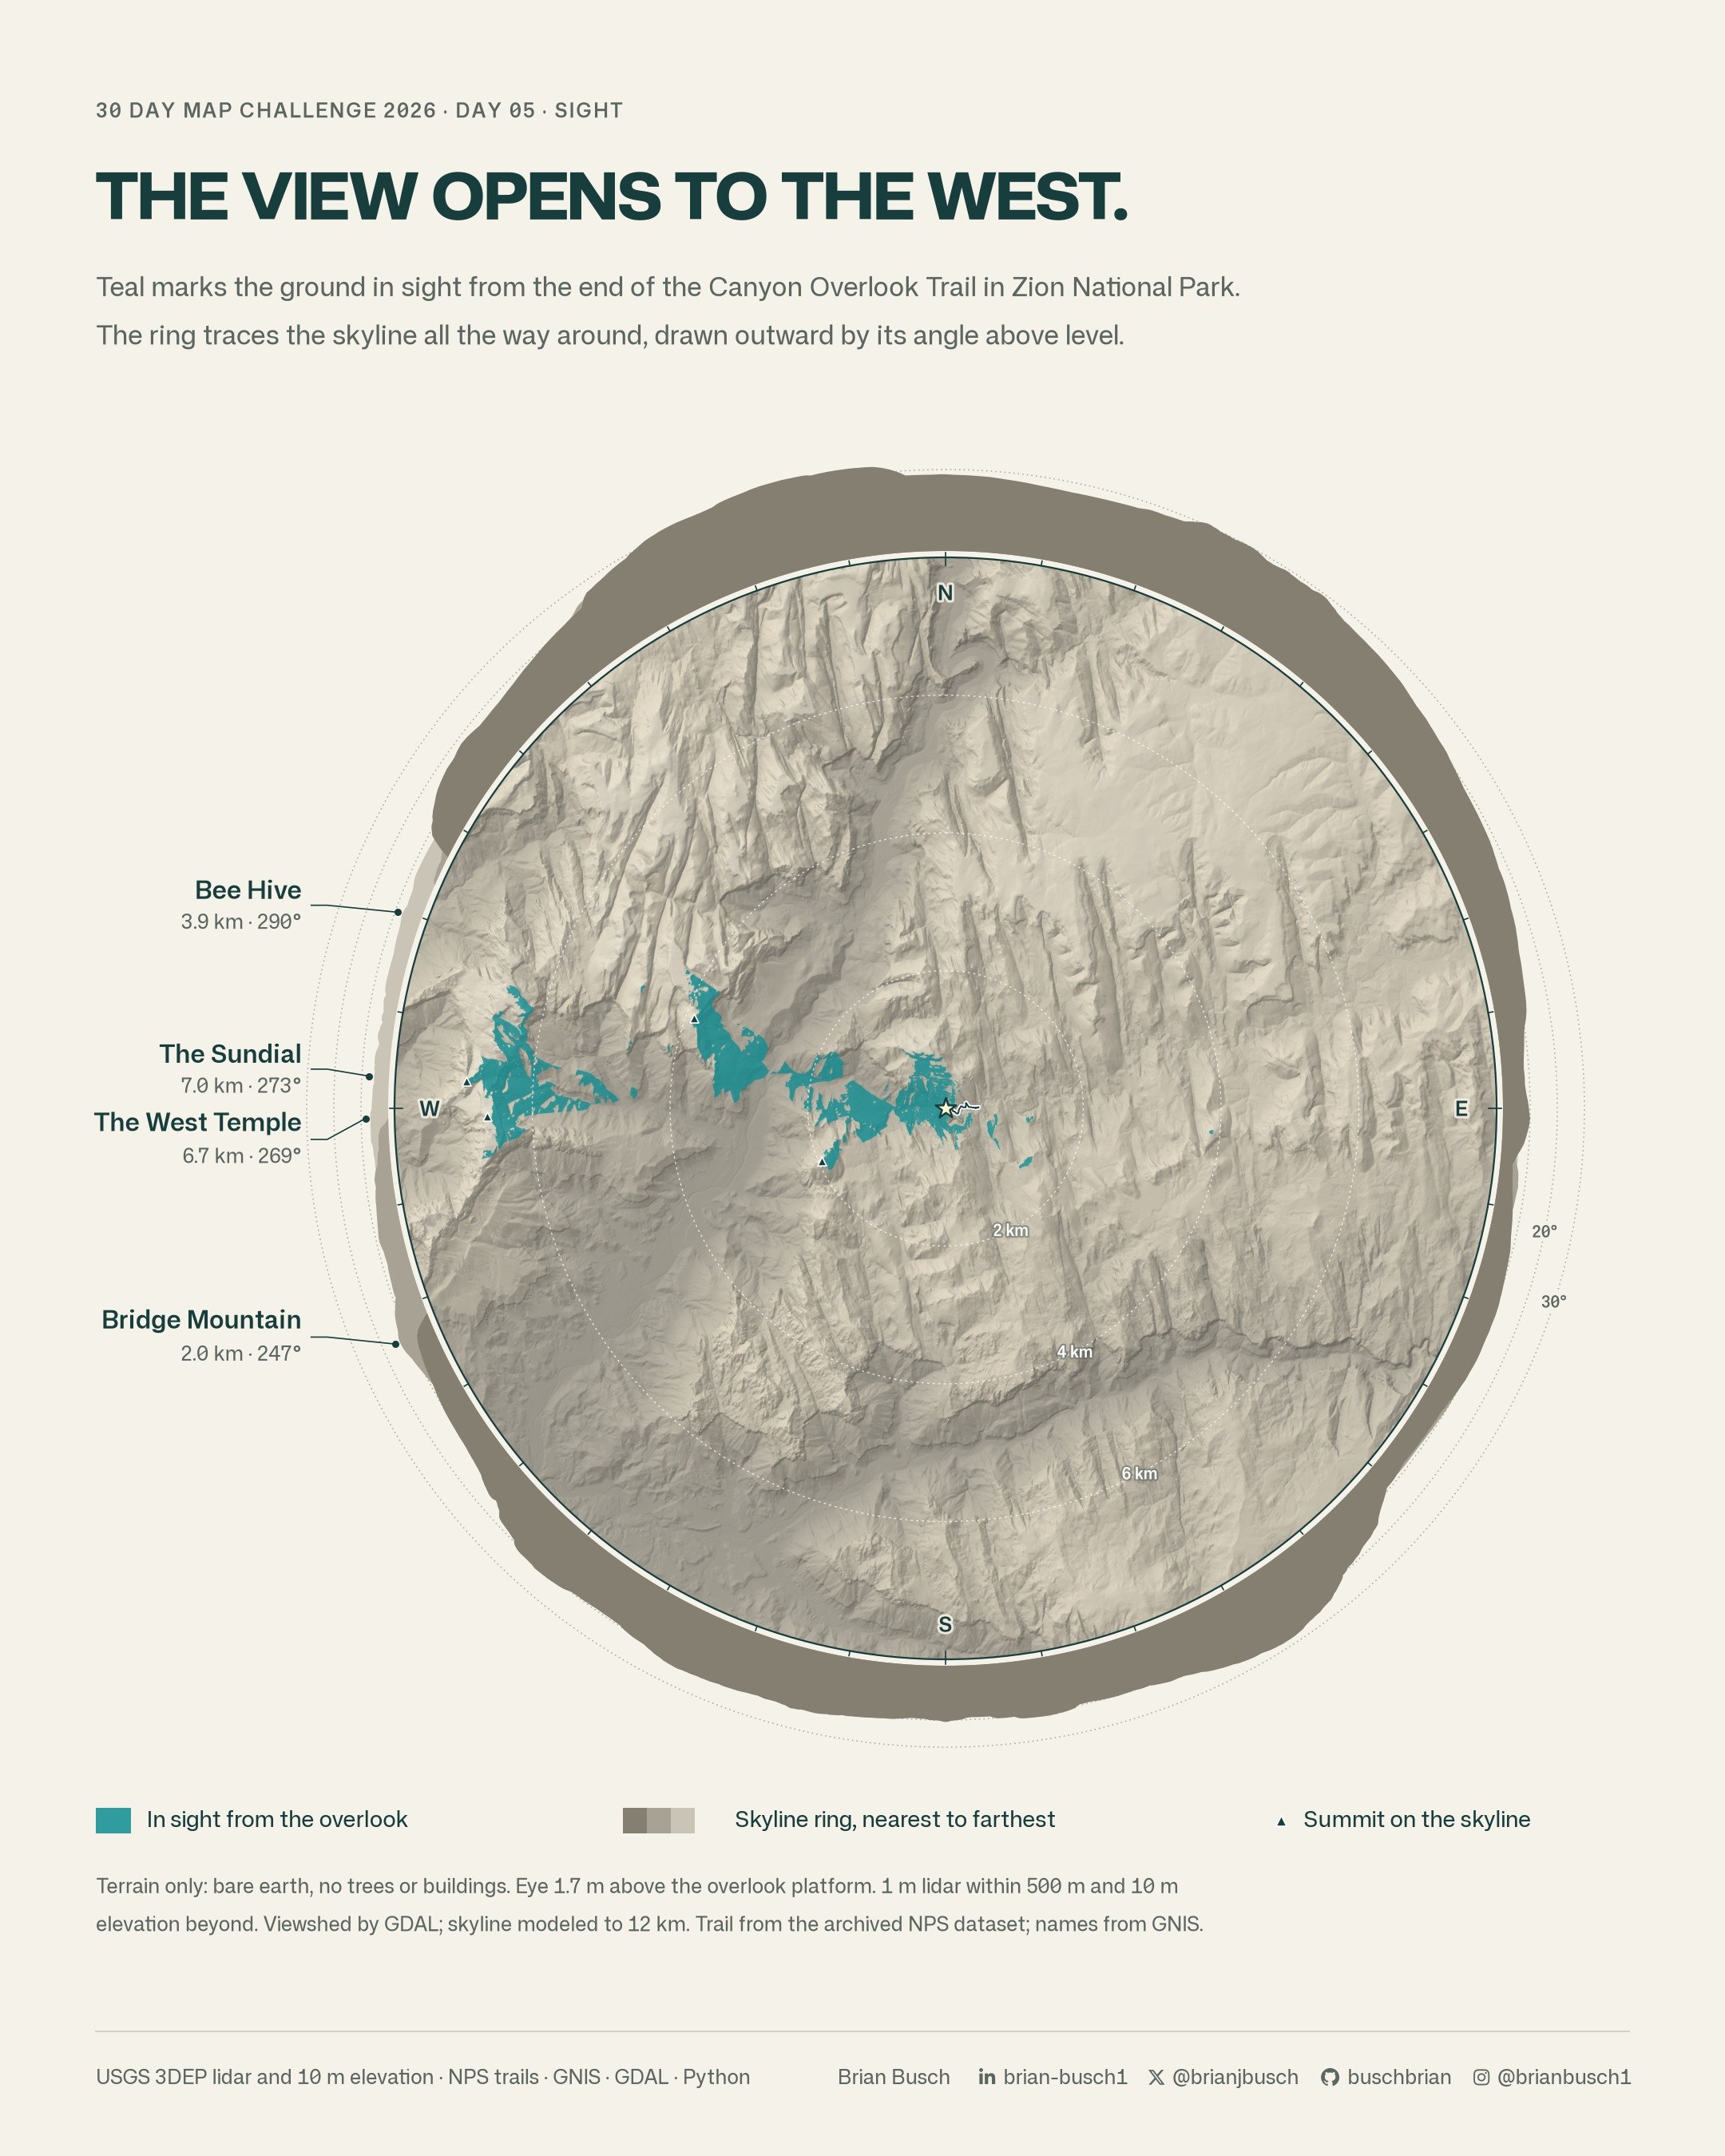
One viewpoint cannot show when that view arrives. So the final map runs the viewshed along the whole walk and keeps the first point where each cell comes into view.
Inside the scripts
Three Python scripts build the map. day05_viewshed_check.py sets the viewpoint and runs the checks. day05_sight.py builds the terrain surface. day05_walk.py walks the trail and draws the still and the video.
The scripts pass the default checks of the ruff linter and use its code format. The excerpts below are trimmed. A # ... line marks a cut.
The 1 m lidar covers a 1 km square around the viewpoint. The script averages it to 2 m cells. A weight then rises from 0 to 1 between 10 m and 30 m inside the tile edge. In that band, the surface is a mix of the two sources.
def hybrid(g, t1, ox, oy):
    """2 m surface over ±HALF: the 10 m DEM, bilinear, with the lidar tile blended in
    from 10 to 30 m inside its edge."""
    # ...
    lid = a1.reshape(a1.shape[0] // 2, 2, a1.shape[1] // 2, 2).mean(axis=(1, 3))
    r0, c0 = int(round((y1 - ly1) / H)), int(round((lx0 - x0) / H))
    ii, jj = np.mgrid[: lid.shape[0], : lid.shape[1]]
    edge = np.minimum.reduce([ii, jj, lid.shape[0] - 1 - ii, lid.shape[1] - 1 - jj])
    w = np.clip((edge * H - 10) / 20, 0, 1)
    win = dem[r0 : r0 + lid.shape[0], c0 : c0 + lid.shape[1]]
    dem[r0 : r0 + lid.shape[0], c0 : c0 + lid.shape[1]] = w * lid + (1 - w) * win
return dem, float(x0), float(y1)day05_sight.py. The two surfaces meet without a step.GDAL does the line-of-sight work. The script writes the surface once as a raw ENVI raster. Then it calls gdal_viewshed for each position. GDAL writes 1 for a visible cell and 0 for a hidden cell.
The -cc 0.85714 option lowers far ground for the curve of the earth and for light that bends in the air.
def viewshed(src, ox, oy, oz, radius, cell):
    fmt = ["-q", "-of", "ENVI"]
    at = ["-ox", repr(float(ox)), "-oy", repr(float(oy)), "-oz", repr(float(oz))]
    reach = ["-tz", "0", "-md", f"{radius:g}", "-cc", repr(V.CC)]
    values = ["-vv", "1", "-iv", "0", "-ov", "2"]
    with tempfile.TemporaryDirectory() as tmp:
        out = Path(tmp) / "v.bin"
        cmd = ["gdal_viewshed", *fmt, *at, *reach, *values, str(src), str(out)]
        subprocess.run(V.GDAL + cmd, check=True, capture_output=True)
return V.read_envi(out, cell=cell)day05_sight.py. V.GDAL runs GDAL 3.13 from a pixi environment.The walk loop is short. At each position, the eye height comes from the median lidar ground within 3 m along the line, so one bad cell does not move the eye. The last position is the viewpoint itself, set by the check script.
gdal_viewshed measures the observer height above its own surface. The script passes the eye height above the lidar ground, less the surface value under the observer. Each cell then keeps the first distance where it is visible. The red class needs only one comparison.
walk = np.append(np.arange(0, s_obs, STEP), s_obs)
# ...
first = np.full((rb - ra, cb - ca), np.inf, np.float32)
# ...
for i, s in enumerate(walk):
    p = route.interpolate(s)
    if i == len(walk) - 1:
        gz = obs["ground"]
    else:
        q = np.arange(max(0.0, s - 3), min(s_obs, s + 3) + 0.01, 1.0)
        pts = [route.interpolate(v) for v in q]
        gz = float(np.median([V.z1m(t1, pt.x, pt.y)[0] for pt in pts]))
    ro, co = int((y1 - p.y) // H), int((p.x - x0) // H)
    oz = gz + V.EYE - float(dem[ro, co])
    v, wx0, wy1 = S.viewshed(src, p.x, p.y, oz, S.MAP_R, H)
    vis = v == 1
    # ...
    first[crop & np.isinf(first)] = s
# ...
rim_only = np.isfinite(first) & (first >= s_obs - RIM)
seen = np.isfinite(first)day05_walk.py. STEP is 5 m, RIM is 15 m and V.EYE is 1.7 m.The script caches the 155 viewsheds under a hash of the viewpoint, the walk positions, the eye height and the GDAL settings. A change to the map style reuses the cache.
Checks
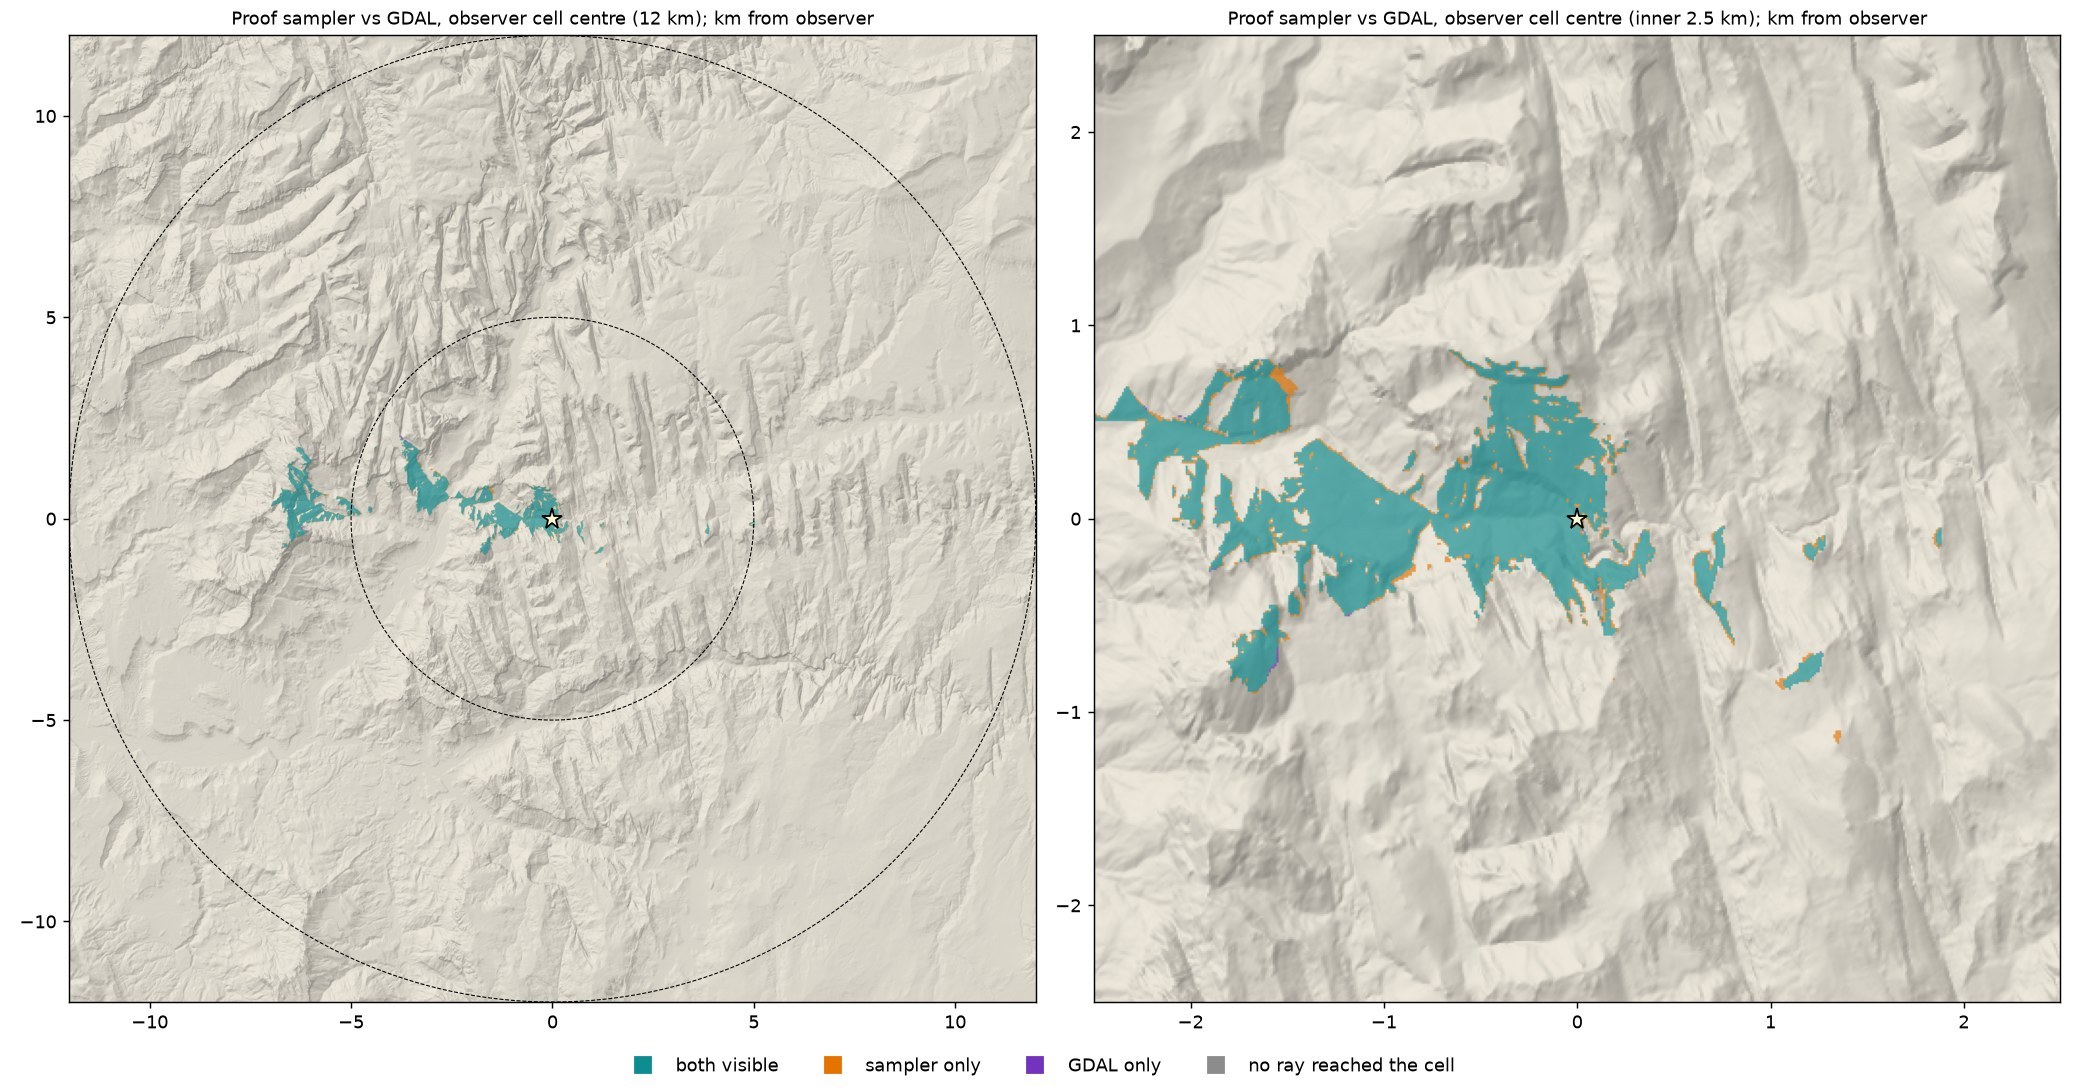
- On the 10 m DEM,
gdal_viewshedand a second, separate sightline sampler agree on more than 99.9% of cells within 12 km. - Against 6,000 exact sightlines to random cells, both methods are correct on 99.7% of them or more.
- Within 475 m of the viewpoint, the 1 m lidar sees about 18% less ground than the 10 m DEM. That result is why the build uses lidar near the trail.
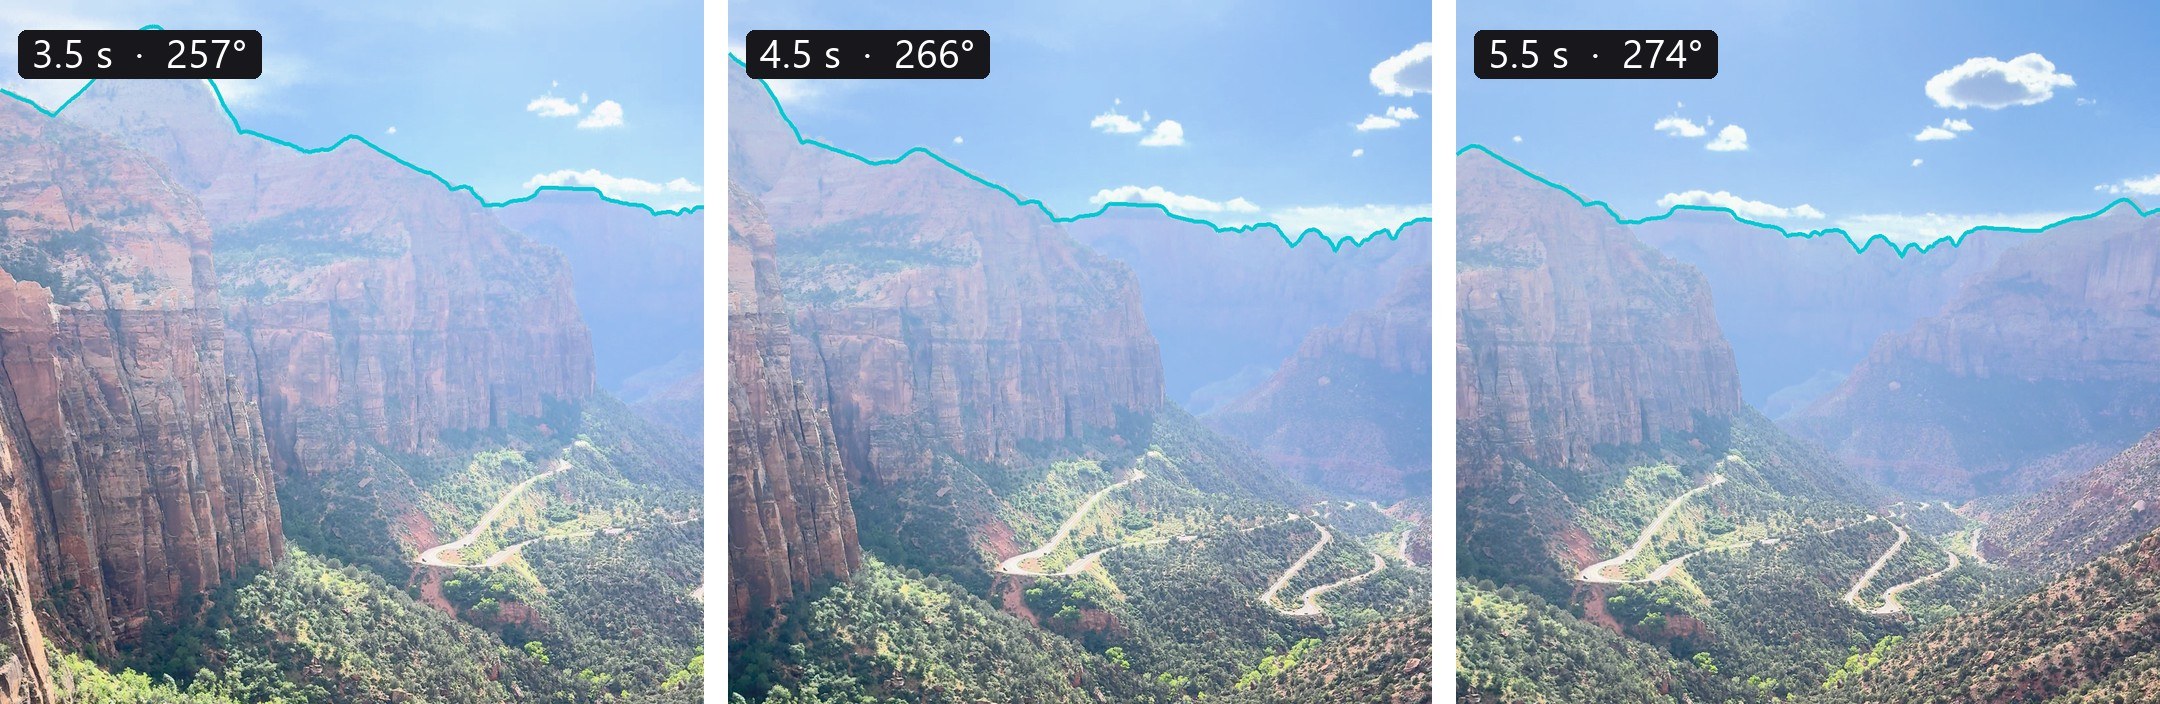
- I took a phone video at the viewpoint. In three of its frames, the modeled skyline lies on the sky edge, with a median miss of about 0.1 degree.
- A 10 m move in any direction at the viewpoint keeps 96% to 98% of the ground in view. The view belongs to the platform.


Symbol guide
- Gold marks ground in view from some point on the trail.
- Red marks ground that comes into view only at the rim, in the last 15 m.
- In the video, gold is ground in view from the walker now. Pale gold is ground seen earlier on the walk.
- Black dots mark summits on the skyline. Gray names with open circles mark peaks out of view.
- The map is turned 20 degrees so Zion Canyon runs up the page. North points slightly left of up.
- The strip under the map shows how much ground is in view at each point on the walk.
- The labels follow the National Park Service map of Zion. Green labels mark visitor buildings, as on that map.
Data notes
- The model is bare earth, with no trees or buildings. Vegetation along the trail could block some glimpses.
- The trail line is from the 2014 dataset, not a new survey. Near the rim, its position error could shift where the view opens by a few meters.
- "The last 15 m" is the model's rim class. It is not a measured step.
- The model has no haze, and it does not show how far a person can see on a given day.
Data and credit
The U.S. Geological Survey provides the 3DEP elevation data. The National Park Service provides the trail line and the park map that the labels follow. Peak names come from that map and from the USGS Geographic Names Information System (GNIS). Roads, creeks and rivers come from OpenStreetMap. Narration uses a HeyGen voice.
Day 5 bonus
The View You Hike For
I ran the same walk model on a longer Zion trail, with tree heights added. The East Mesa Trail goes 3.4 mi (5.4 km) from the East Mesa Trailhead to Observation Point. The point looks down Zion Canyon toward Springdale.

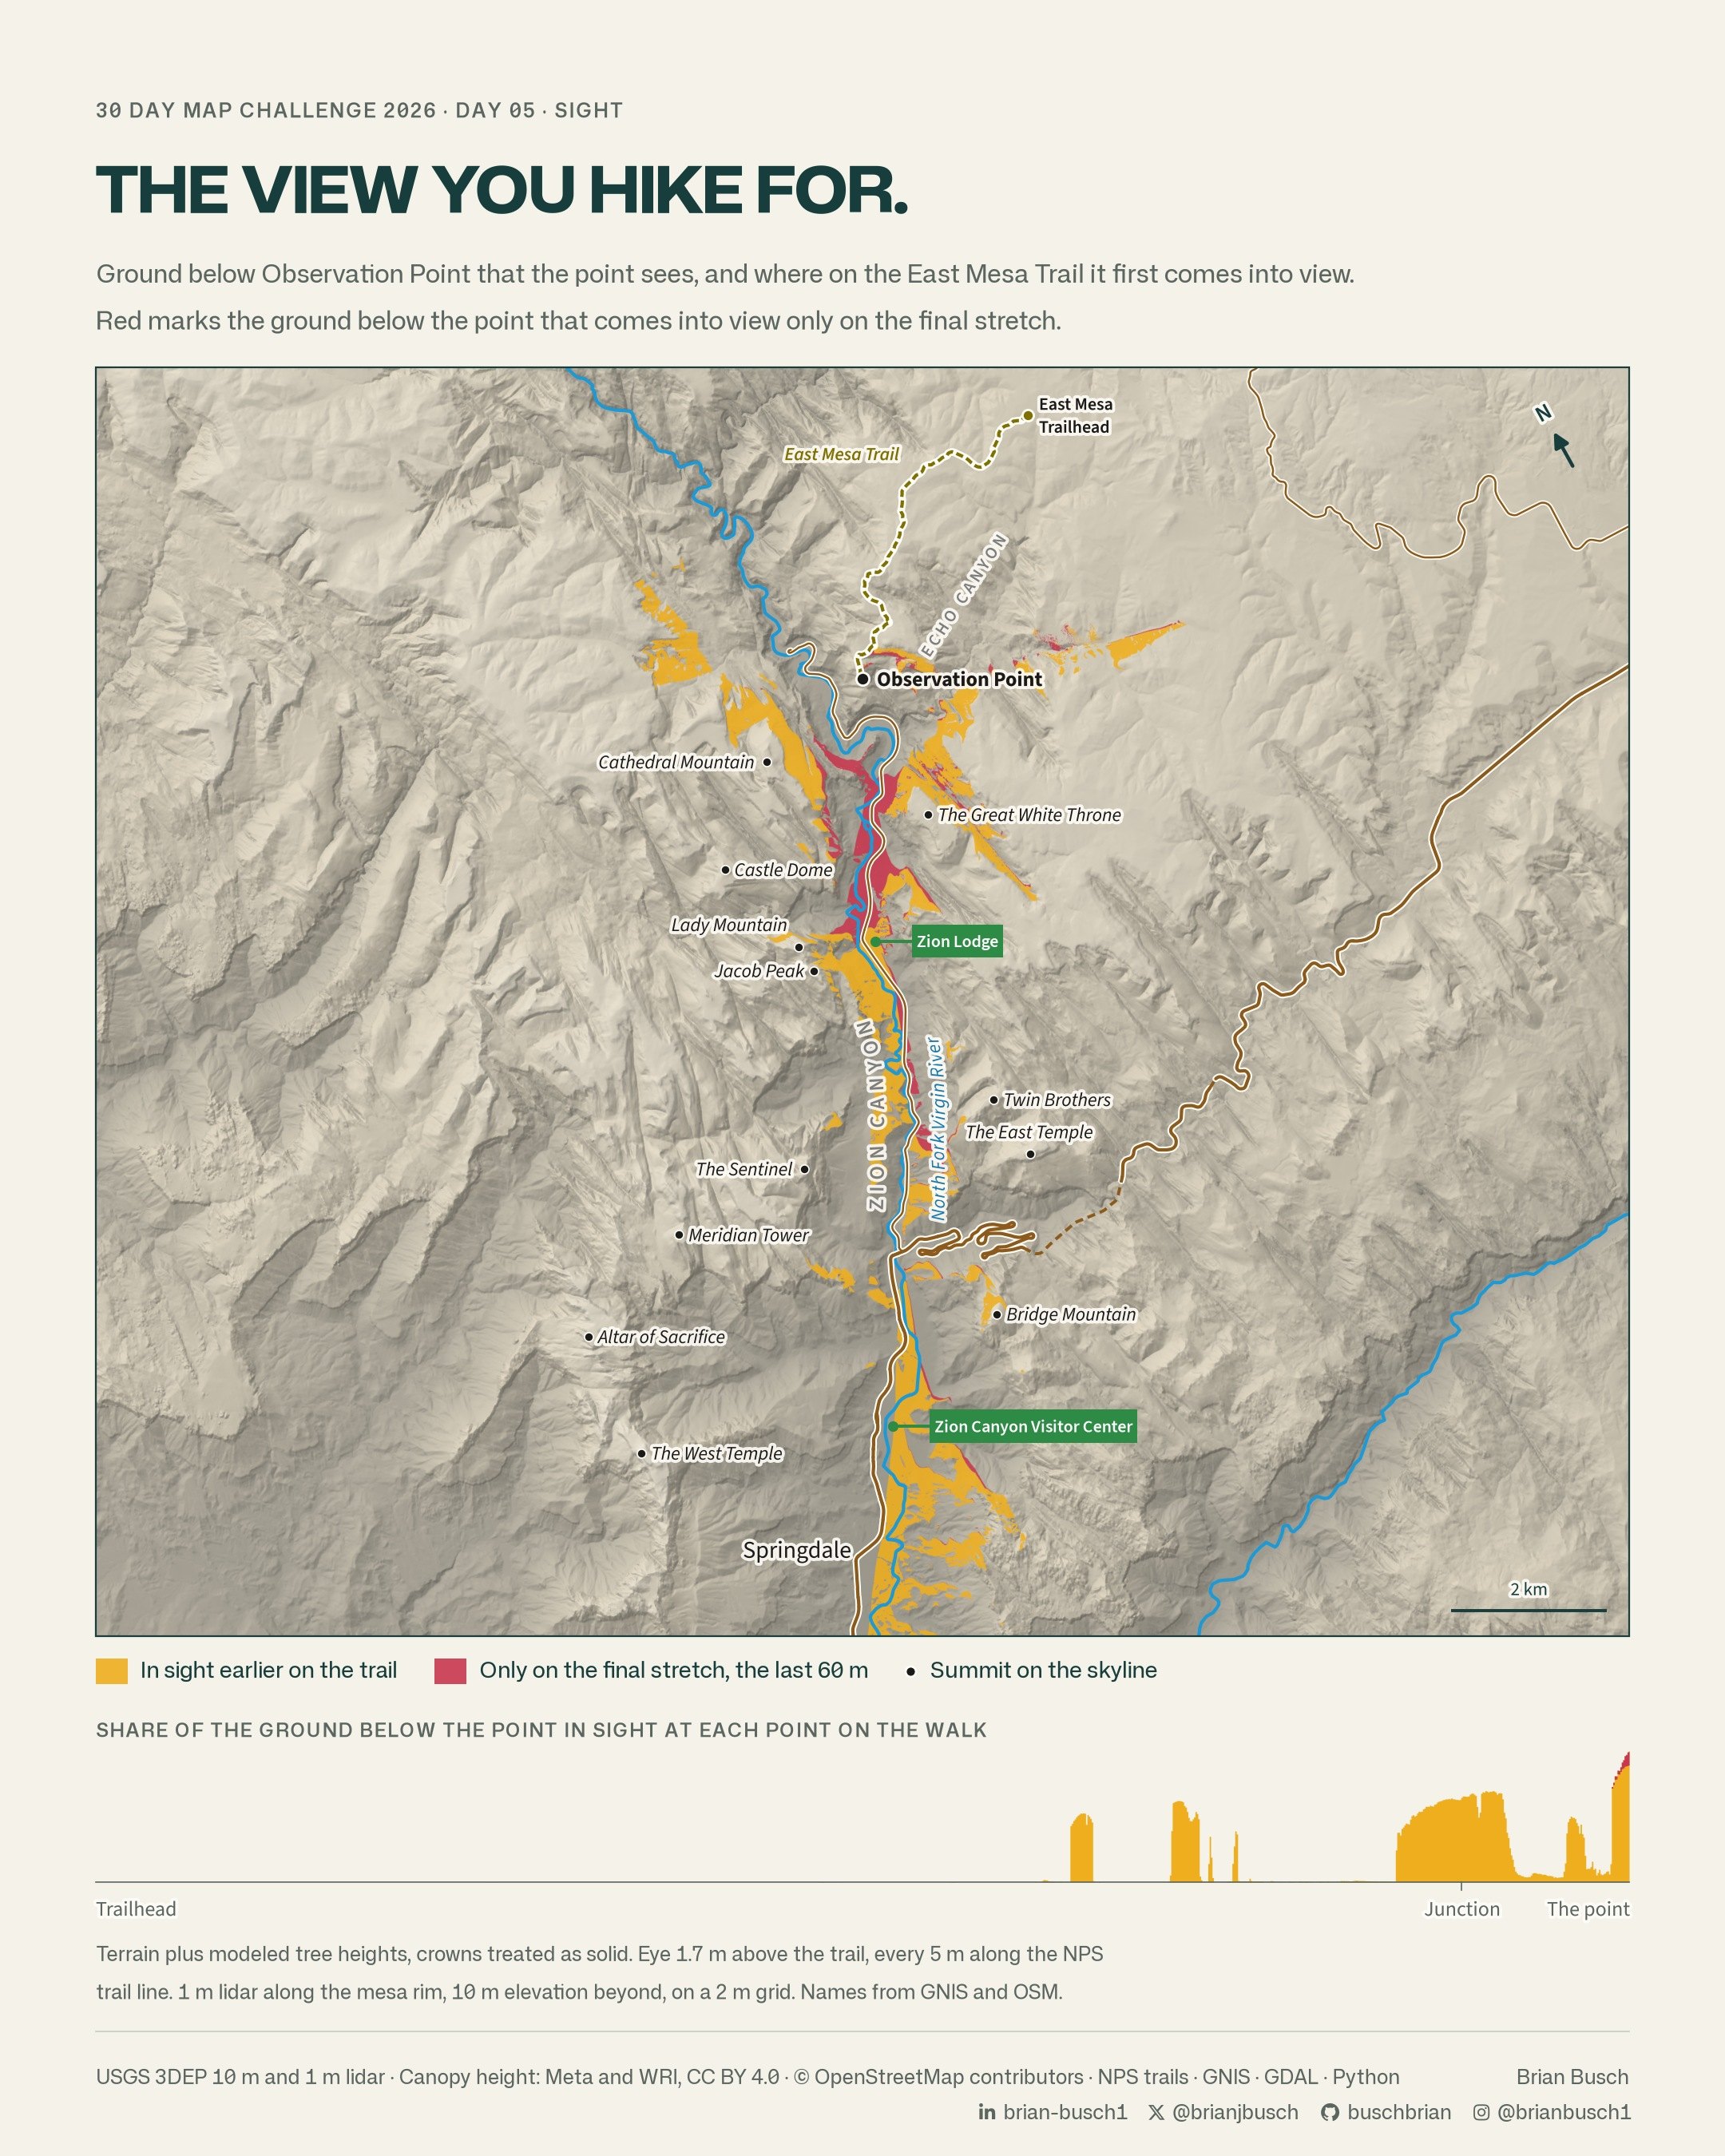
For the first 2 mi (3.3 km), the model shows almost none of the canyon. Less than 1% of the ground below the point is in view. The trail stays back from the rim, and the mesa top blocks the view.
Then the view comes in glimpses. Between 2.1 and 2.5 mi (3.4 and 4.0 km), gaps show ground far down the canyon, toward Springdale. Near the junction, at about 3 mi (4.8 km), the canyon floor around Zion Lodge comes into view.
Angels Landing comes last. The model first shows its summit from the last 200 ft (60 m) of the trail. Only there does the view below the point stay open.
The glimpses add up. About 89% of the ground below the point is in view somewhere before the final stretch. But most of it shows only through gaps along the way.
Trees in the model
- The Day 5 map above uses bare earth. This model adds tree heights from the High Resolution Canopy Height Maps by Meta and the World Resources Institute (WRI), at 1 m.
- Each tree crown counts as solid. The model clears trees within 10 ft (3 m) of the trail, so the eye is never inside a crown.
- 1 m lidar covers the mesa rim, and 10 m elevation covers the ground beyond. The model works on a 2 m grid, with a viewshed every 5 m along the trail.
- The model counts only ground lower than the point that the point can see. The analysis stops 10.9 mi (17.5 km) south of the point.
- The trees shorten some glimpses but remove none of them.
Data notes
- The canopy map can miss short and sparse trees, such as pinyon pine and juniper. Along this trail it shows few trees.
- Solid crowns block more of the view than real trees do.
- The model has no brush, boulders or haze.
- The trail line comes from the NPS trail data, not a new survey.
Data and credit
The U.S. Geological Survey provides the 3DEP elevation data and lidar. Meta and WRI provide the canopy heights under the CC BY 4.0 license. The National Park Service provides the trail line. Peak names come from GNIS. Roads and rivers come from OpenStreetMap.
Map data © OpenStreetMap contributors.